Figure 1.
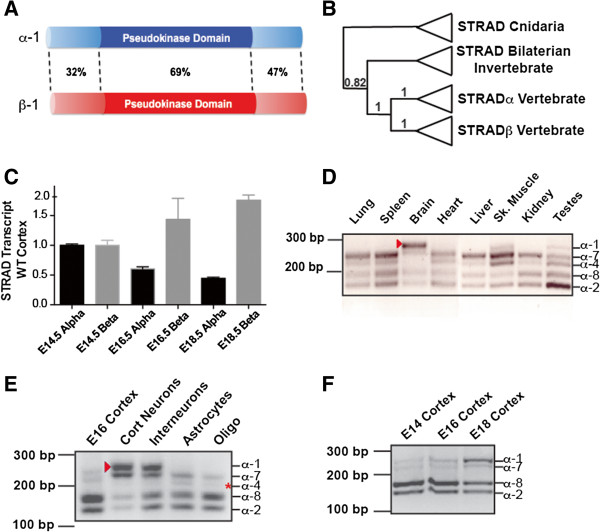
STRAD splice forms are expressed in a tissue-specific manner. (A) Schematic of mouse STRADα and STRADβ proteins indicating percent similarity between the two proteins. (B) Schematic of phylogenetic tree based on the STRAD gene from Bilaterians using Cnidaria as the outgroup with posterior probabilities indicating support for nodes (0–1, 1 being the strongest support) labeled on nodes of interest. The tree is based on MrBayes phylogenetic analysis (see Additional file 1: Figure S1). (C) Quantitative real-time-PCR of STRADα and STRADβ across developmental time. (D) Reverse transcriptase-PCR (RT-PCR) of STRADα indicates that multiple variants exist in distinct tissue types. In particular, the largest species (arrowhead) appears to be specific to brain, skeletal muscle and testes. (E) RT-PCR products from enriched cultures of the dominant CNS cell types. (STRADα-1 isoform – arrowhead; STRADα-4 isoform - asterisk). Cort neurons – cerebral cortex primary neurons; Interneurons – medial ganglionic eminence primary neurons, Astrocytes – primary post-natal day 1 astrocytes, Oligo – primary oligodendrocyte cultures. (F) RT-PCR of STRADα isoforms across developmental time in the cerebal cortex. CNS, central nervous system.

