
Figure 4. Ctx+ perfusion increase compared to HC.
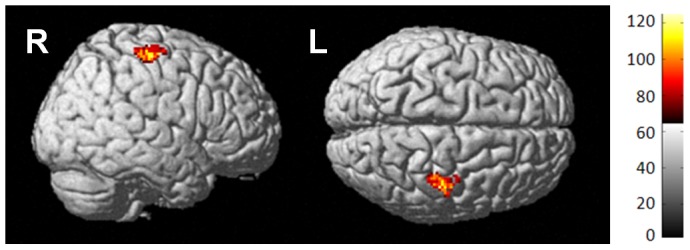
Surface rendering of Ctx+ increase compared to HC over time indicates statistically significant perfusion increase in Ctx+ in the right precentral gyrus post-treatment.
Official websites use .gov
A
.gov website belongs to an official
government organization in the United States.
Secure .gov websites use HTTPS
A lock (
) or https:// means you've safely
connected to the .gov website. Share sensitive
information only on official, secure websites.
Surface rendering of Ctx+ increase compared to HC over time indicates statistically significant perfusion increase in Ctx+ in the right precentral gyrus post-treatment.