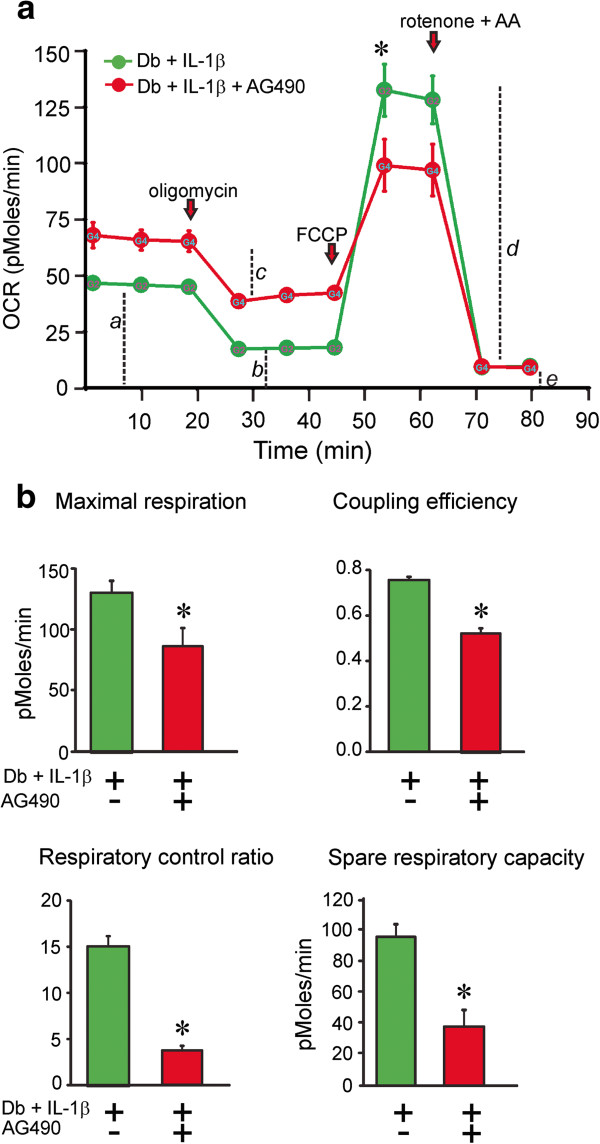
Figure 8.

Mitochondrial bioenergetics in cultured neurons from diabetic mice is abnormal when it is treated with AG490. OCR was measured in the same conditions as Figure 7. DRG neurons were cultured from 3–5 month STZ-induced diabetic mice treated with IL-1β (green) or from 3–5 month STZ-induced diabetic mice treated with AG490 for 1 hr than stimulated with IL-1β (red) in the presence of low dose neurotrophic growth factors. Data are expressed as OCR in pmol/min for 1000 cells (there were approximately 2500–5000 cells per well). The OCR measurements in (a) diabetic treated with IL-1β (green) or diabetic treated with AG490 for 1 hr than stimulated with IL-1β (red) at the 1 μM concentration of FCCP were plotted. Bioenergetic parameters were determined as described in Figure 7 and presented in (b) for DB+IL-1β (green), DB+AG490+IL-1β (red). Values are mean ± SEM of n = 5 replicate cultures; *p < 0.05 by Student’s t-Test. Control cultures were treated with IL-1β for 24 hr and revealed increases in maximal respiration; control, 159.8 ± 11.7 vs IL-1β, 299.5 ± 70.0 and spare respiratory capacity; control, 116.5 ± 16.6 vs IL-1β, 191.0 ± 44.0. Values are means ± SEM, n=2-4, and expressed as pMoles/min normalized to neuron number (per 5000 cells).
