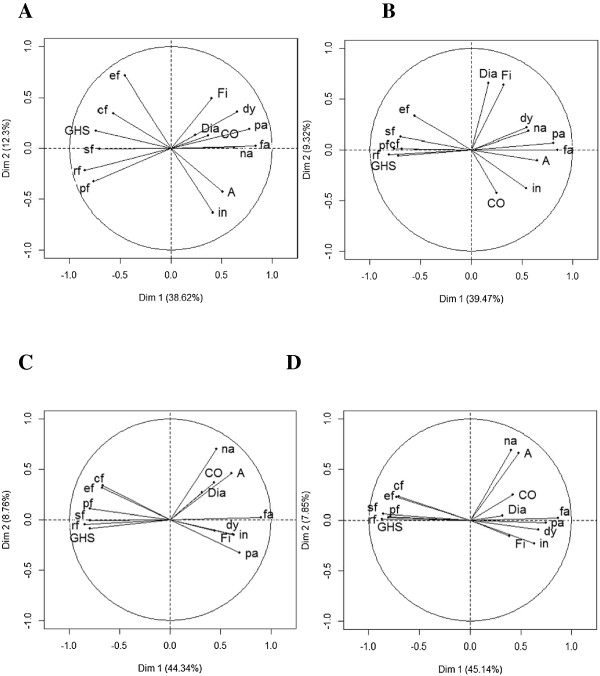
Figure 2.
Graph representing the correlation between QLQ-C30 scores and the first two principal components of Principal Component Analysis at each prospective measurement time (N = 192): at baseline (Panel A), just after surgery (Panel B), at three months (Panel C) and at six months (Panel D). The QLQ-C30 measures five functional scales (physical functioning (pf), role functioning (rf), emotional functioning (ef), cognitive functioning (cf), social functioning (sf)), global health status (GHS), financial difficulties (Fi) and eight symptom scales (fatigue (fa), nausea and vomiting (na), pain (pa), dyspnea (dy), insomnia (in), appetite loss (A), constipation (CO), diarrhea (Dia)).

