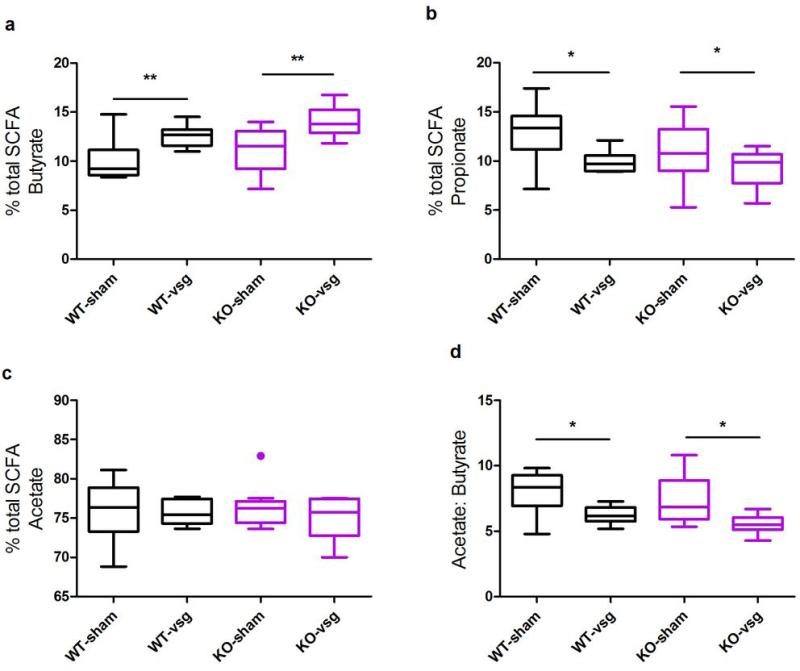
Extended Data Figure 6. VSG alters the abundance of cecal SCFAs.
The relative concentration of butyrate (A) and propionate (B), but not acetate (C) was altered by VSG, and this did not differ depending on genotype. D) The acetate:butyrate ratio is increased following VSG. Data are presented as Tukey boxplots. * = p< 0.05, ** = p< 0.01, *** = p< 0.001. Also see Extended Data Table1. n= 12 WT-sham, 7 WT-VSG, 9 KO-sham, 8 KO-VSG.

