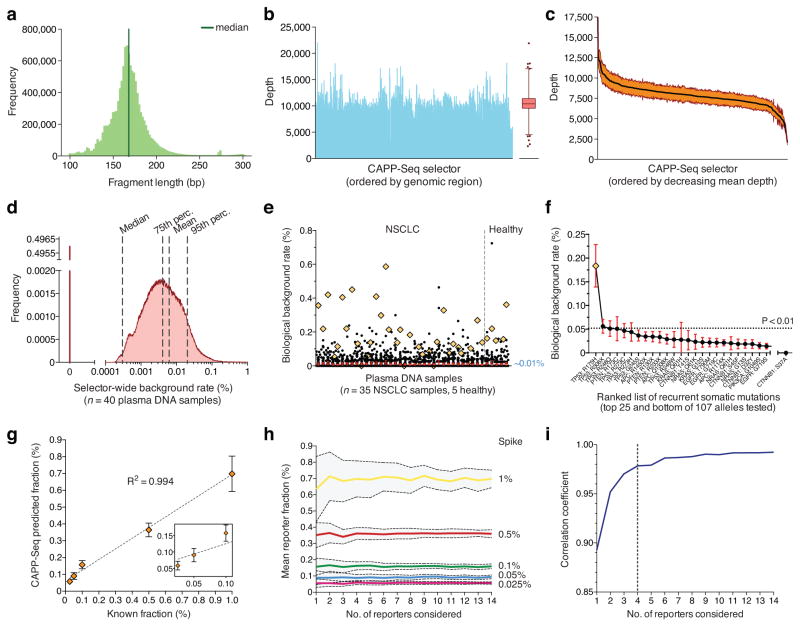
Figure 2. Analytical performance.
(a–c) Quality parameters from a representative CAPP-Seq analysis of plasma DNA, including length distribution of sequenced circulating DNA fragments (a), and depth of sequencing coverage across all genomic regions in the selector (b). (c) Variation in sequencing depth across plasma DNA samples from four patients. Orange envelope represents s.e.m. (d) Analysis of background rate for 40 plasma DNA samples collected from 13 patients with NSCLC and five healthy individuals (Supplementary Methods). (e) Analysis of biological background in d focusing on 107 recurrent somatic mutations from a previously reported SNaPshot panel25. Mutations found in a given patient’s tumor were excluded. The mean frequency over all subjects was ~0.01%. A single outlier mutation (TP53 R175H) is indicated by an orange diamond. (f) Individual mutations from e ranked by most to least recurrent, according to mean frequency across the 40 plasma DNA samples. The p-value threshold of 0.01 (horizontal line) corresponds to the 99th percentile of global selector background in d. (g) Dilution series analysis of expected versus observed frequencies of mutant alleles using CAPP-Seq. Dilution series were generated by spiking fragmented HCC78 DNA into control circulating DNA. (h) Analysis of the effect of the number of SNVs considered on the estimates of fractional abundance (95% confidence intervals shown in gray). (i) Analysis of the effect of the number of SNVs considered on the mean correlation coefficient between expected and observed cancer fractions (blue dashed line) using data from panel h. 95% confidence intervals are shown for e,f. Statistical variation for g is shown as s.e.m.

