
Figure 3. Sensitivity and specificity analysis.
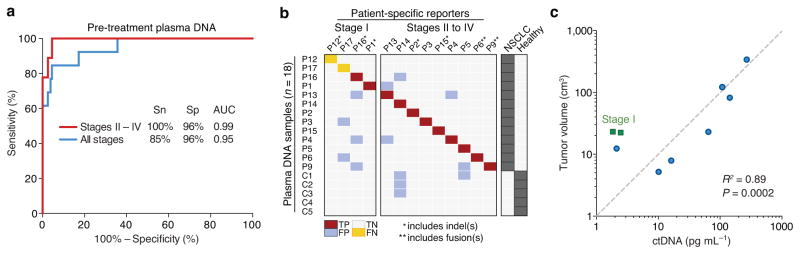
(a) Receiver Operating Characteristic (ROC) analysis of plasma DNA samples from pre-treatment samples and healthy controls, divided into all stages (n = 13 patients) and stages II–IV (n = 9 patients). Area Under the Curve (AUC) values are significant at P < 0.0001. Sn, sensitivity; Sp, specificity. (b) Raw data related to a. TP, true positive; FP, false positive; TN, true negative; FN, false negative. (c) Concordance between tumor volume, measured by CT or PET/CT, and pg mL−1 of ctDNA from pretreatment samples (n = 9), measured by CAPP-Seq. Patients P6 and P9 were excluded due to inability to accurately assess tumor volume and differences related to the capture of fusions, respectively (see Supplementary Methods). Of note, linear regression was performed in non-log space; the log-log axes and dashed diagonal line are for display purposes only.