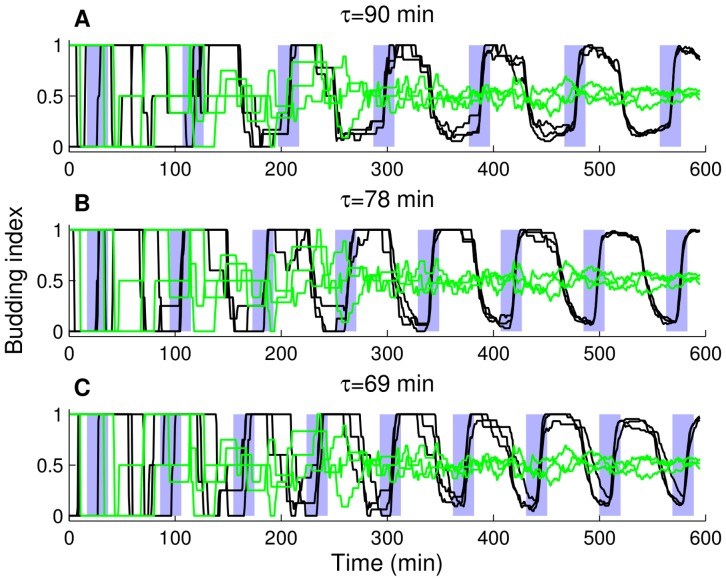
Figure 3. Budding index trajectories under different conditions.
Simulation results. Evolution of the budding index (fraction of budded cells in a cell population at a given time) for the unforced cells (cln3, green lines) and the cells with forced CLN2 expression (cln3 MET3-CLN2, black lines). Forcing period is 90 min in (A), 78 min in (B), and 69 min in (C). Each individual trajectory represents a pedigree initiated by a single daughter cell, three trajectories are shown per forcing period. Blue shaded areas represent the time intervals in which MET3-CLN2 is active (time lag for the MET3 promoter turn on/off is taken into account).

