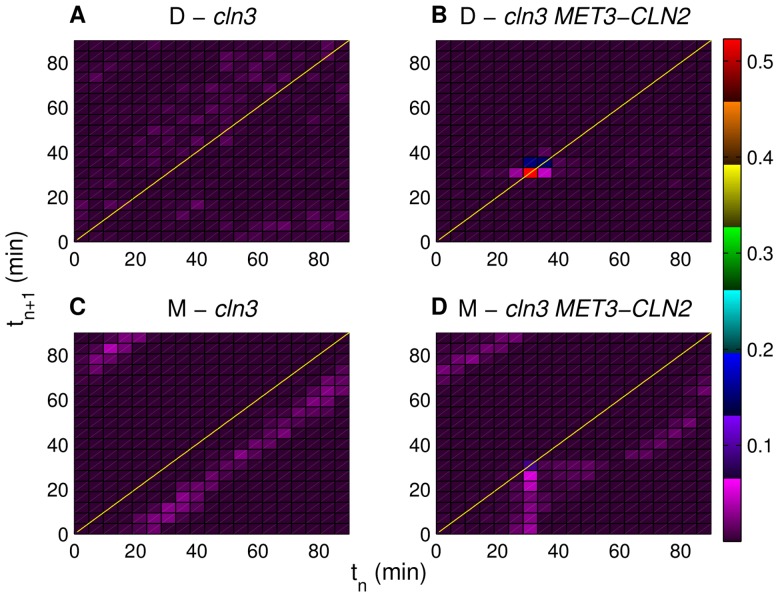
Figure 4. Simulated return maps for successive cells with and without forced CLN2 expression.
No forcing is applied in (A) and (C), whereas the forcing period is 90 min in (B) and (D). “D” and “M” stand for daughters and mothers, respectively. Each map divides the 0–90 min time interval into 20 equally sized subintervals. Colors represent the fraction of data points in each map region as depicted in the color map on the right. Only the bright colors of this map are used in the return maps except for the map regions with very low data density. Lines  are depicted in yellow. Each return map is made using the data collected from eight independently generated pedigrees.

