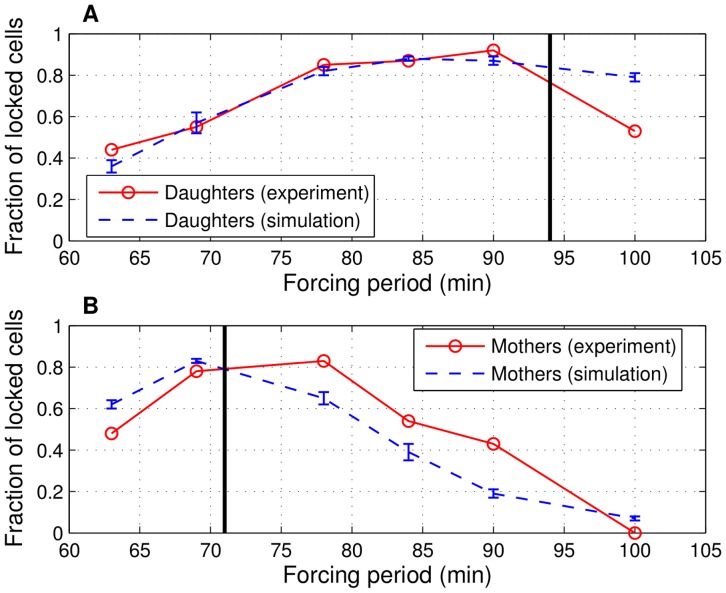
Figure 6. Fractions of locked daughters and mothers.
Forced CLN2 expression with six forcing periods: experimental [7] and simulation values for daughters in (A) and mothers in (B). Black vertical lines represent the natural (cln3, no forced CLN2 expression) mother and daughter cycle times. The range of each locked fraction in the simulations (mean  standard deviation) is depicted by the blue error bars, whereas the red circles correspond to experimental values. Each range from the simulations is computed from 15 independent realizations. Each realization contains eight independently generated pedigrees of cells generated over the course of 700 min starting from a single daughter or mother cell.

