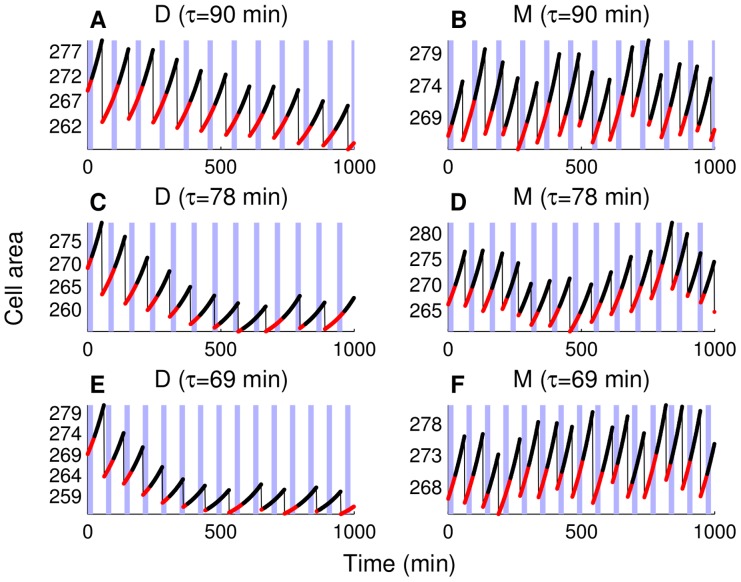
Figure 7. Cell size trajectories for successive mother and daughter cells.
Data is collected during the simulations with three different periods of forced CLN2 expression: 90 min (A) and (B), 78 min (C) and (D), and 69 min (E) and (F). Shaded blue areas show the time intervals with forced expression (without delay in the MET3 turn-on/turn-off as in Figure 3C of [7]). Unbudded parts of the trajectories are plotted with red, budded parts are black, and thin black lines represent division events. The correct order of cell cycle events is enforced during the simulations (Table S9). Daughter simulations (marked with “D”) start from a daughter initial condition set, whereas mother simulations (marked with “M”) start from a mother initial condition set. These initial condition sets are extracted from the endpoints of 2000 min simulations with no forced CLN2 expression.

