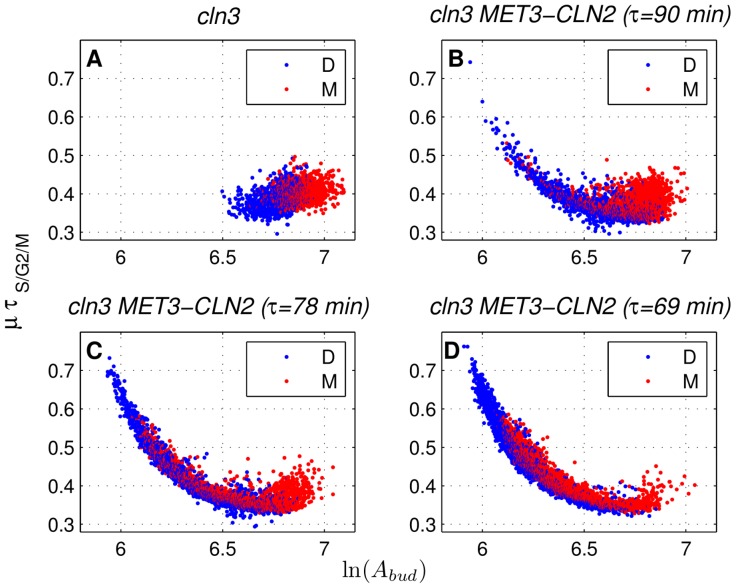
Figure 9. Characterization of size control in the S/G2/M phase.
Raw data from the cln3 simulations (A) and the simulations with 90 min (B), 78 min (C), and 69 min (D) periods of forced CLN2 expression. Cell area at budding is denoted by  , whereas
  is the rate of exponential cell growth and
  is the budded period duration. “D” and “M” stand for daughters and mothers, respectively. Simulation data is collected from eight independently generated pedigrees per forcing period.

