
Table 1. Single cell statistics of cln3 strain (mass doubling time min): experimental and simulation values (before and after parameter optimization).
| Experiment [7] | Simulation before optimization | Simulation after optimization | |
| Mean cycle time (M) | 71.00 min | 77.10 0.44 min 0.44 min |
73.46  0.19 min 0.19 min |
| Mean cycle time (D) | 94.00 min | 87.18 0.69 min 0.69 min |
92.54 0.49 min 0.49 min |
Mean  (M) (M) |
18.00 min | 28.65 0.36 min 0.36 min |
24.75 0.18 min 0.18 min |
Mean  (D) (D) |
36.00 min | 39.97 0.51 min 0.51 min |
45.63 0.38 min 0.38 min |
| CV cycle time (M) | 0.17 | 0.19 0.01 0.01 |
0.13 0.00 0.00 |
| CV cycle time (D) | 0.24 | 0.31 0.01 0.01 |
0.27 0.00 0.00 |
CV  (M) (M) |
0.38 | 0.51 0.01 0.01 |
0.38 0.01 0.01 |
CV  (D) (D) |
0.52 | 0.64 0.01 0.01 |
0.51 0.01 0.01 |
| # complete cycles | - | 2558 226 226 |
2573 241 241 |
| Cycle failure ratio | - | 0.00 0.00 0.00 |
0.00 0.00 0.00 |
| Fitting error | - | 0.23 0.01 0.01 |
0.14 0.00 0.00 |
Parameter optimization results in 39% reduction in the fitting error. Fitting error is defined as 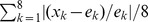 , where
  and
and  are the statistical data points in simulations and experiments, respectively (
 : mean cycle time of mothers,
  : mean cycle time of daughters,
  : mean G1 duration of mothers,
  : mean G1 duration of daughters,
  : CV of cycle time among mothers,
  : CV of cycle time among daughters,
  : CV of G1 duration among mothers,
  : CV of G1 duration among daughters, and
  through
  denote the simulation values for the same statistics). Simulation statistics (mean
  standard deviation) are computed from 15 independent realizations. In each realization, eight pedigrees are generated. Each pedigree of cells is initiated by a single daughter (D) or mother (M) cell. CV denotes coefficient of variation (standard deviation normalized by the mean), whereas
  represents the G1 duration. Experimental mass doubling time of 84 minutes [7] is used in the simulations. The number of failed cycles (due to event execution errors listed in Table S9) normalized by the number of complete cycles is the cycle failure ratio. Matlab script to reproduce the mean and CV values (rightmost column) is provided as File A in File S1.