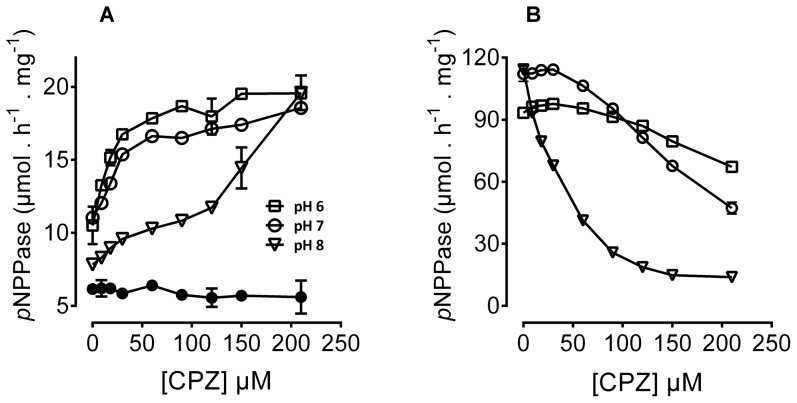
Figure 5. Effect of CPZ on pNPP hydrolysis by Na+,K+-ATPase.
pNPPase activity was measured in the presence of histidine buffer (with the pH adjusted with Tris/HCl), 10 mM MgCl2, 10 mM Na2 +-pNPP, 100 mM NaCl (A) or 100 mM KCl (B) in the presence of the indicated CPZ concentrations and in the absence of ATP. Released pNP was measured in a spectrophotometer at 410 nm as described under Materials and Methods. Data are expressed as µmol hydrolyzed pNPP · h−1 · mg−1 (at 24°C). The black circles depict the effect of linoleic acid on pNPPase activity in the presence of 100 mM Na+ at concentrations identical to those of CPZ. Note that the residual activity seen in panel B at high CPZ concentrations is likely due to the presence of 20 mM Na+ added with pNPP.

