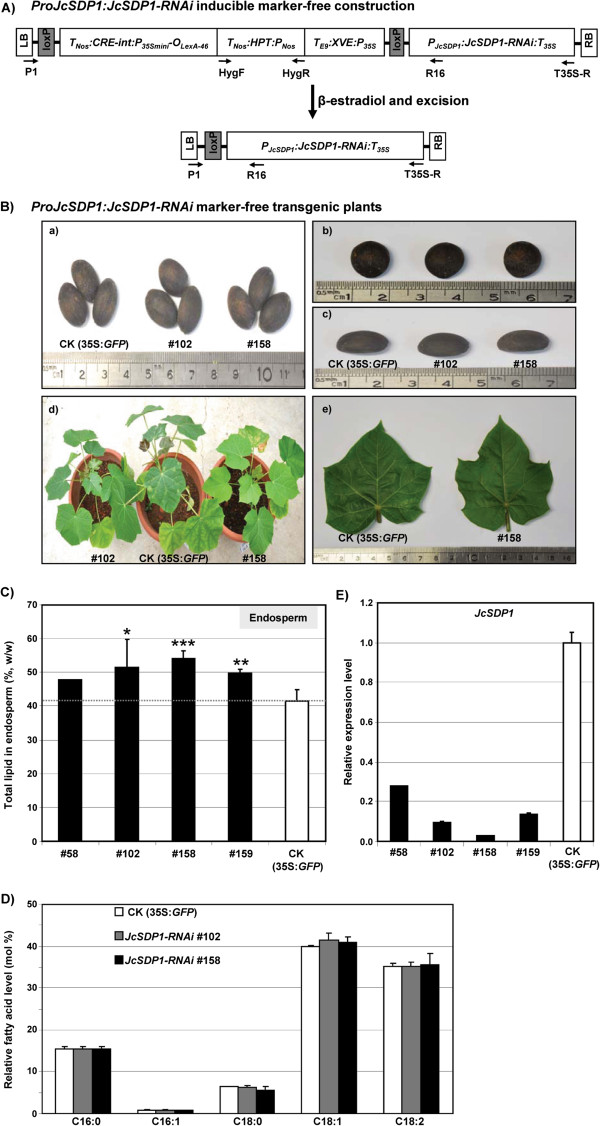
Figure 5.
Production ofProJcSDP1:JcSDP1-RNAi transgenic Jatropha plants and analysis of seed oils. (A) Structure of the inducible ProJcSDP1:JcSDP1-RNAi marker-free construct. (B)ProJcSDP1:JcSDP1-RNAi marker-free transgenic plants: (a-c) T1 generation of dried seeds; (d) overall phenotype of T1 transgenic plants generated from T1 embryos; (e) size comparison of the fifth leaf between control (CK; 35S:GFP) plants and the JcSDP1-RNAi transgenic line #158. (C) Analysis of total lipid content in mature endosperm of T1 seed. (D) Fatty acid profile in JcSDP1-RNAi transgenic lines. (E)JcSDP1 transcript levels in transgenic Jatropha lines. JcTubulin expression levels were used as an internal control. Numbers refer to transgenic line numbers. Asterisks indicate a statistically significant difference compared with the control, *P?<?0.05, **P?<?0.01, ***P?<?0.001 versus control (CK; 35S:GFP) plants, in different biological replicates.

