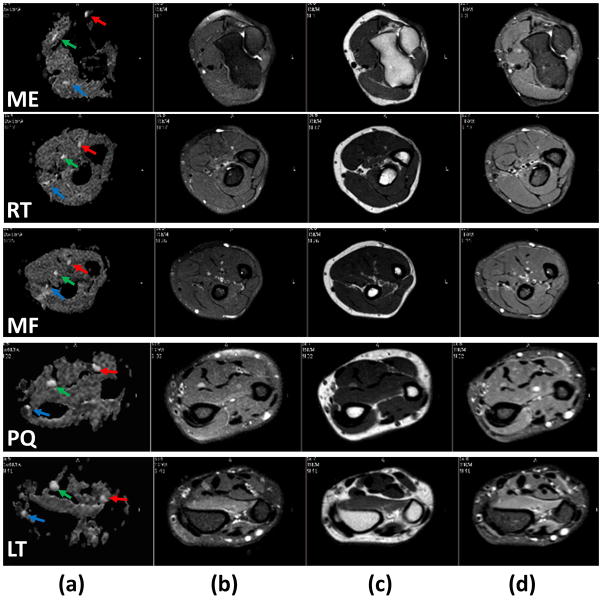
Figure 3.
Comparison of axial grey scale FA map (first column), fat-suppressed (FS) T2-weighted (second column), T2-weighted without fat suppression (third column), and STIR (Fourth column) at the levels of medial epicondyle (first row), radial tuberosity (second row), middle forearm (third row), pronator quadratus proximal margin (fourth row), and Lister’s tubercle (fifth row) obtained from the forearm of a healthy control. The superior contrast and improved conspicuity of the FA map allows easy identification of median (green arrow), ulnar (red arrow), and superficial radial (blue arrow) nerves compared to other images.

