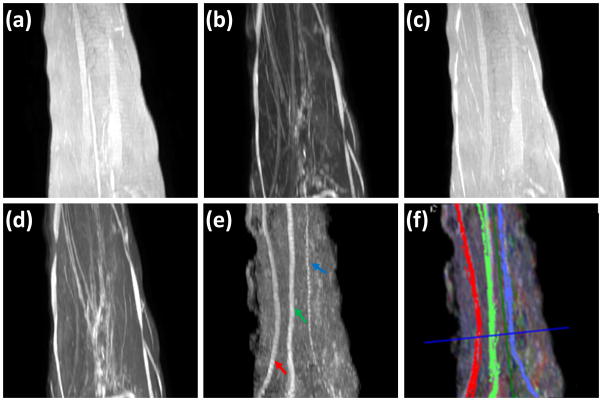
Figure 4.
Comparison of MIP images derived from: (a) T1-weighted(b) FS T2-weighted (c) T2-weighted (d) STIR, (e) FA maps, and (f) 3D fiber tractography of median nerve (green), ulnar nerve (red) and superficial radial (blue) superposed on FA MIP, of the left forearm in a control. It is very difficult to identify the nerves on images a, b, c and d. However, the FA map provided much better delineation for easy identification of median (green arrow), ulnar (red arrow), and superficial radial nerves (blue), and fiber tracts show excellent correlation with the FA MIP images.

