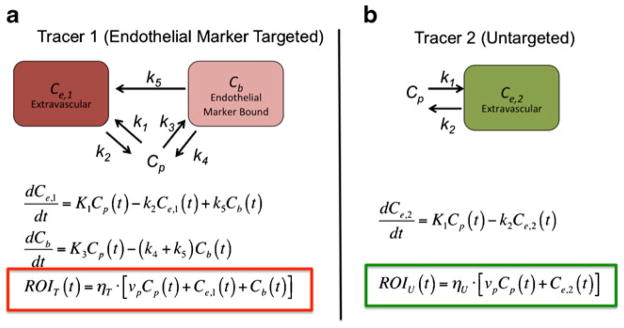
Fig. 1.

Compartment models for an endothelial marker targeted tracer (a), and an untargeted tracer (b). The rate constants k1–k5 represent (1) extravasation of the tracer from the blood (Cp) to the extravascular space (Ce,1 for the targeted tracer and Ce,2 for the untargeted tracer), (2) efflux of the tracer from the extravascular space to the blood, (3) binding to endothelial markers (Cb), (4) dissociation from endothelial marker into blood, and (5) dissociation from endothelial marker into extravascular space. Below each compartment model diagram are the differential equations that express the rate of change of tracer concentration in each compartment. The colored boxes highlight the relationship between tracer concentrations in each compartment and the signal measured in a given region of interest (ROIT for the targeted in red and ROIU for the untargeted tracer in green) as a function of time, t. The parameters ηT and ηU represent all factors associated with the relation of measured signal to tracer concentration for the targeted and untargeted tracers, respectively, such as detection efficiency, quantum efficiency of the tracers (for fluorescence imaging), tissue absorption of signal, and uneven excitation of tracer (for fluorescence).
