
Fig. 2.
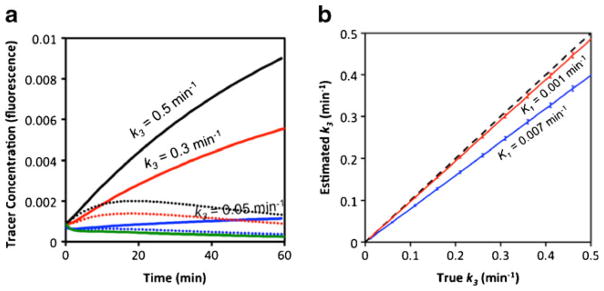
Simulated targeted tracer curves (blue, red, and black) and an untargeted tracer curve (green), prior to noise addition, are presented in a. The blue curves correspond to k3 = 0.05 min−1, the red to k3 = 0.3 min−1, and the black to k3 = 0.5 min−1. The solid targeted tracer curves correspond to k4 = 0 min−1 (irreversible binding) and the dotted lines to k4 = 0.1 min−1 (reversible binding). Results from fitting the endothelial marker concentration imaging (EMCI) algorithm to the simulated solid curves (irreversible binding) in a to estimate k3 over a range of k3 inputs are presented in b. The blue data represents the results for irreversible binding data simulated with a K1 = 0.007 min−1 while the red data corresponds to the same data simulated with a K1 = 0.001 min−1. The dashed line represents the line of identity between estimated and true k3.