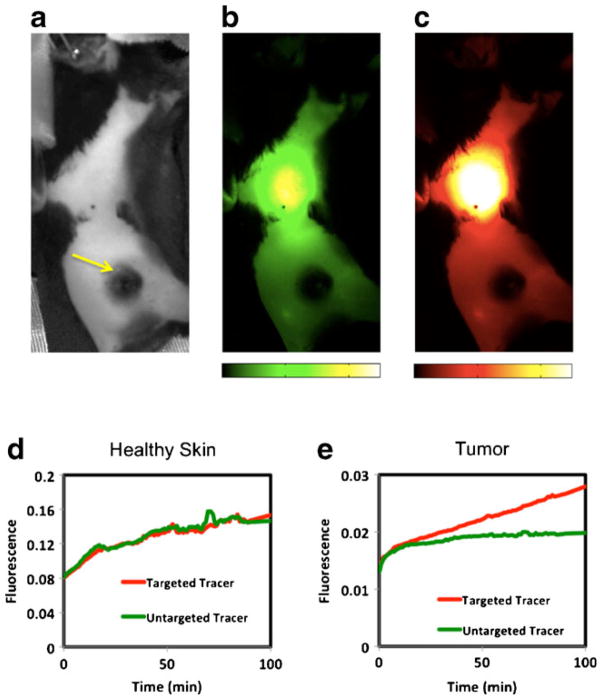
Fig. 4.
A gray-scale white-light image of a shaved melanoma mouse positioned in the small animal fluorescence imaging system is presented in a. The yellow arrow highlights the location of the melanoma. Fluorescent images of the untargeted (green-scale) and targeted (red-scale) tracer uptakes at 100-min post-injection are presented in b and c, respectively. The images are equally scaled. Typical uptake curves of the targeted (red curve) and untargeted (green curve) tracer are presented in a region of healthy skin (d) and in the tumor (e). Note the scale of the tumor curves is approximately an order of magnitude lower than those in the healthy skin.

