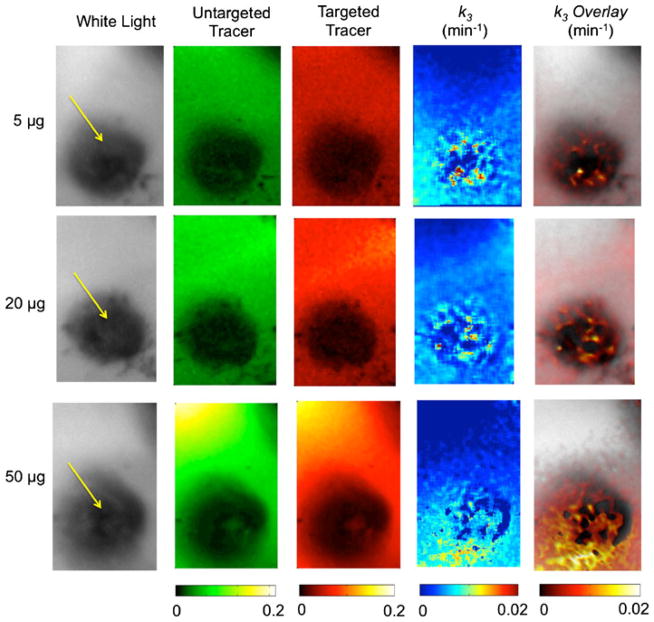
Fig. 5.
Imaging results of melanoma mice administered 5-, 20-, and 50-μg of tracer are presented in rows 1, 2, and 3, respectively. The first column presents a gray-scale white-light image of each melanoma and surrounding healthy tissue (yellow arrow locates the melanoma). The second and third columns of images present the fluorescence uptake of the untargeted and targeted tracers, respectively, at 100-min post tracer injection (note that the 5-μg images are scaled to 0.02 rather than 0.2 in the 20- and 50-μg images). The fourth column of images presents the k3 results from pixel-by-pixel analysis using the endothelial marker concentration imaging algorithm. The fifth column presents the same data overlaid on the white-light image.

