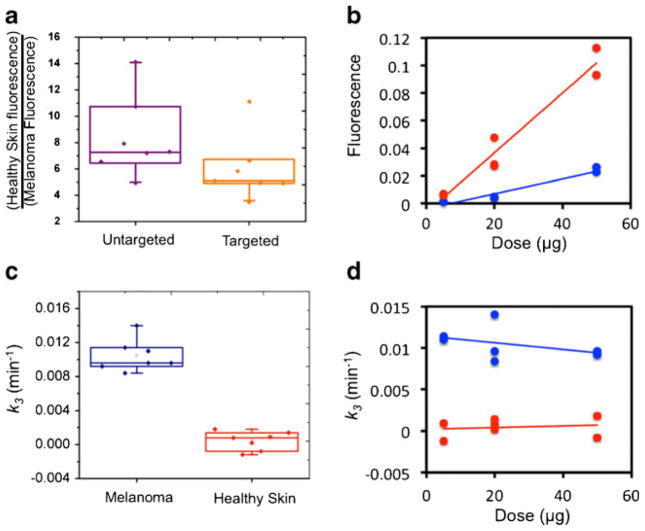
Fig. 6.
A boxplot presenting the ratio of PV1-targeted fluorescence (orange data) and untargeted fluorescence (purple data) uptake at 100-min post tracer injection in the healthy skin vs. the melanoma tissue is presented in a. This fluorescence uptake is plotted in correlation with the injected concentration of tracer for the healthy skin tissue (red data) and the melanoma tissue (blue data) in b. Solid lines represent linear regressions of the data. Boxplots of the endothelial marker concentration imaging algorithm estimates of the binding parameter k3 are presented in c for melanoma (blue data) and healthy skin (red data). Correlations between the k3 estimates in each tissue and the injected tracer concentration are presented in d with the same color code as in c.

