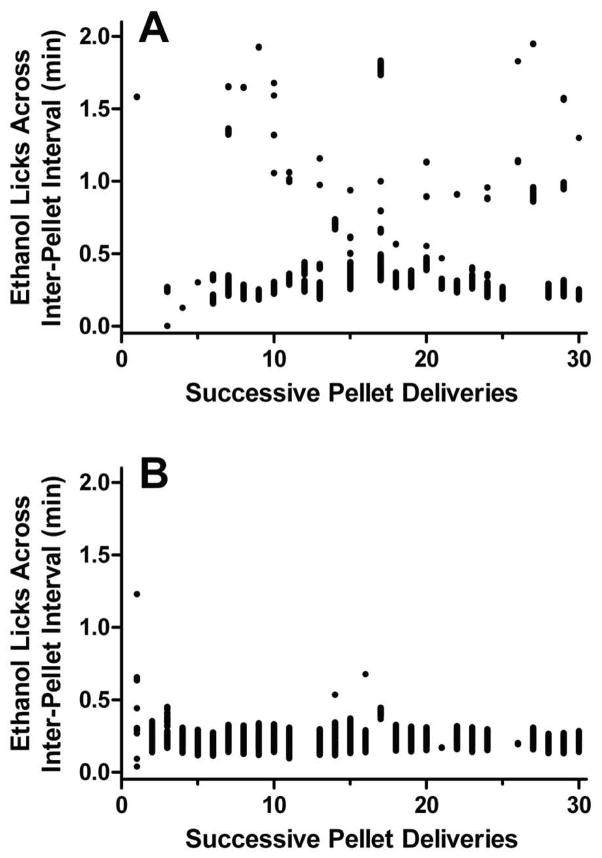
Figure 4. Schedule control throughout the inter-pellet interval.
The distribution of licks on a sipper containing 5% v/v ethanol is shown for a representative D2 mouse. The mouse was exposed to a FT-2 min schedule during 1-h sessions for 10 days. Drinking throughout the inter-pellet interval is depicted on the Y-axis, with 0 min being immediately post-pellet delivery. The initial (panel A) and final (panel B; 10th) session are presented to demonstrate the shift toward greater schedule control with increased experience with the interval as well as the increased number of total licks (1799 vs. 2233; 24% increase). See text for additional experimental details.

