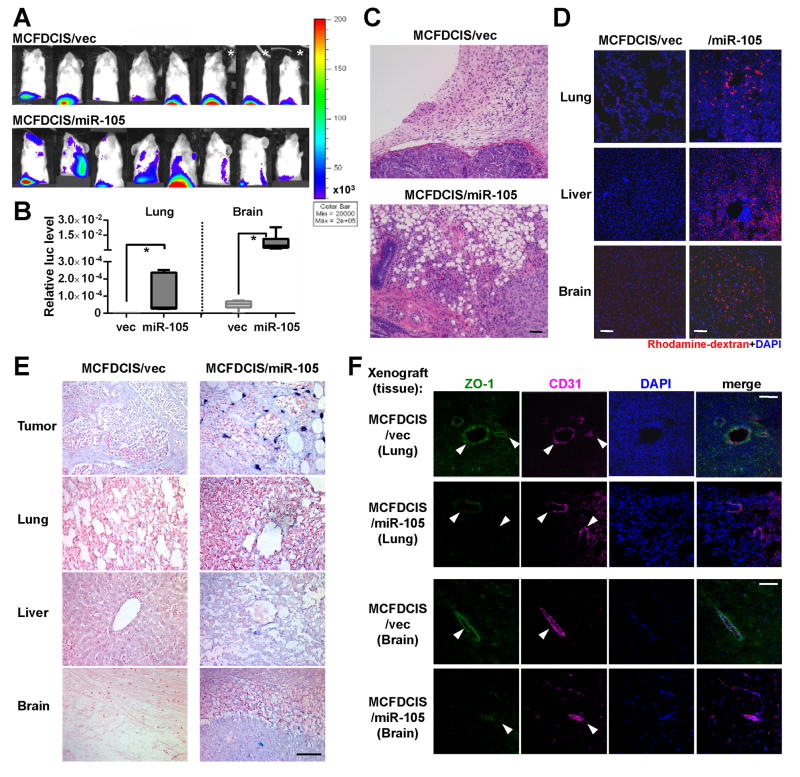
Figure 5. MiR-105 overexpression in poorly metastatic BC cells promotes metastasis in vivo.
(A) Luciferase-labeled MCFDCIS/vec or MCFDCIS/miR-105 cells were injected into the No. 4 mammary fat pad of NSG mice (n = 8). BLI at week 6 was shown. *Due to the extensive tumor burden these 3 mice were sacrificed at week 5.5; their images at week 5 were shown. (B) Quantification of metastases in lung and brain. Mice shown in A were sacrificed at week 6 and tissues were subjected to RT-qPCR of luciferase gene using mouse 18S as internal control (n = 8). Results are presented as mean ± SD. *p < 0.05. (C) Representative H&E images of the tumor edges showing local invasiveness. Bar = 50 μm. (D) In vivo vascular permeability determined by the appearance of intravenously injected rhodamine-dextran (red) in various organs. Tissues were collected from mice bearing MCFDCIS/vec or MCFDCIS/miR-105 xenografts (n = 3) that were sacrificed at week 6. Representative images are shown. DAPI (blue): cell nuclei. Bar = 100 μm. (E) Representative images of miR-105 ISH in tissues collected from the two groups. Bar = 50 μm. (F) Collected tissues were subjected to double-label IF for ZO-1 (green) and CD31 (pink). Structures positive for CD31 are indicated by arrowheads. Bar = 100 μm. (See also Figure S4.)

