
Figure 2. Distribution of upregulated and downregulated transcripts in roots and shoots responsive to Cd treatment.
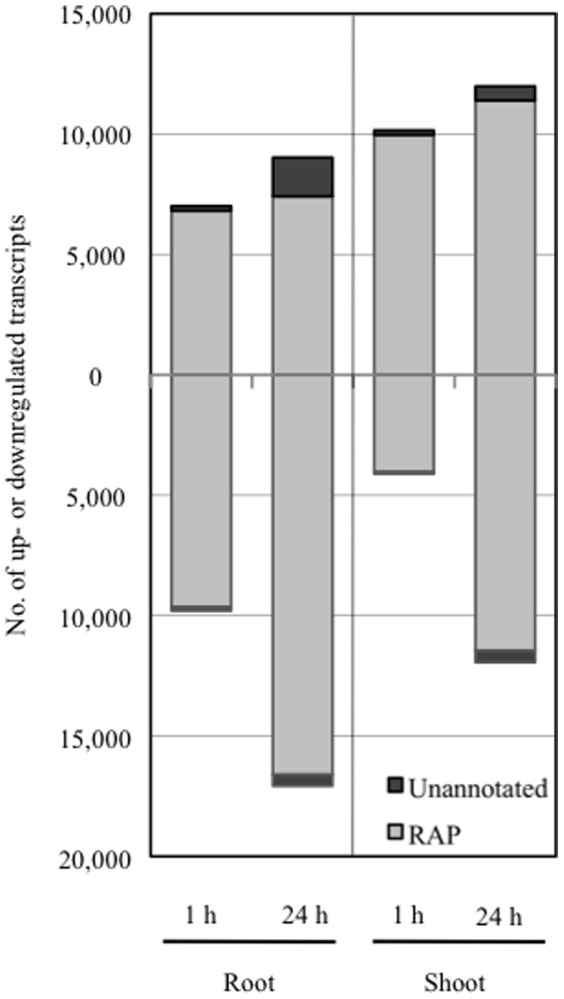
The total numbers of upregulated (upper) or downregulated (lower) transcripts in roots (left) and shoots (right) identified by RNA-Seq were determined by G-tests (FDR < 0.01) at each stress timepoint (1, 24 h) during Cd exposure in comparison with non-treatment (0 h). Each bar shows the distribution of transcripts with matching RAP-DB annotations (grey) and unannotated transcripts (black). The x-axis shows the time course and the y-axis shows number of transcripts.