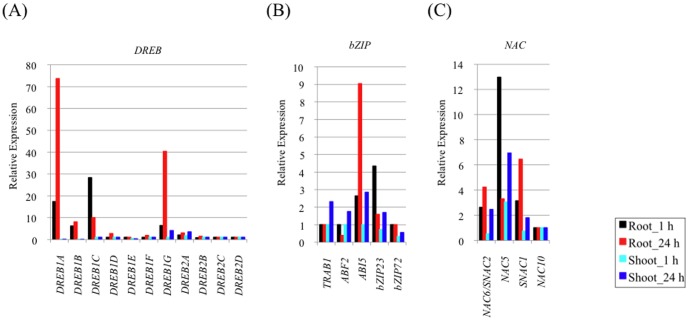
Figure 3. Effects of Cd exposure on rice growth and the expression of abiotic stress-related TF genes.
The relative expression of (A) DREBs, (B) bZIPs and (C) NACs in rice is shown. The x-axis shows transcripts and the y-axis shows relative expression. The black bar shows the relative expression in roots at 1 h, the red bar roots at 24 h, the light blue bar shoots at 1 h and the blue bar shoots at 24 h.

