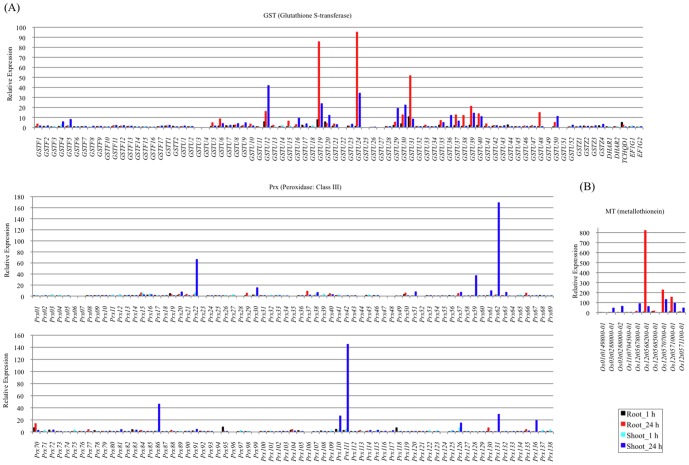
Figure 4. Relative expression of transcripts that may function in defense and detoxification under Cd treatment.
RPKM fold changes at 1 h and 24 h were calculated for Cd treated samples compared with non-treated samples (0 h). (A) Relative expression of the GST gene family, (B) the Prx gene family, and (C) the MT gene family are shown. The x-axis shows transcripts and y-axis shows relative expression. The black bar shows the relative expression in roots at 1 h, the red bar roots at 24 h, the light blue bar shoots at 1 h and the blue bar shoots at 24 h.

