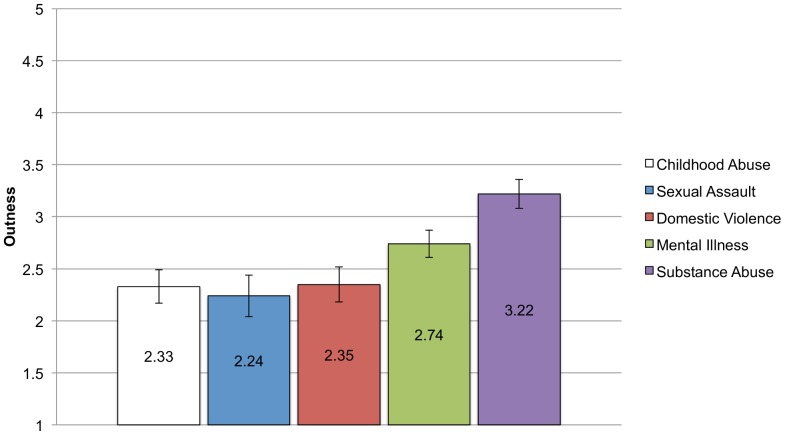
Figure 6. Means and standard errors for Outness for each CSI Group.
Analyses controlling for income, education, and sex found significant differences in mean levels of outness reported across the groups. Bonferroni corrected post-hoc comparisons show that the substance abuse group reported being significantly more out about their identity than the childhood abuse (p<.001), sexual assault (p = .001), and domestic violence (p = .001) groups but not different from the mental illness group (p = .12). There were no other significant between group differences.

