
Figure 4. Correlation between MCPyV and PtvPyV reactivity and between TSPyV and OraPyV1 reactivity.
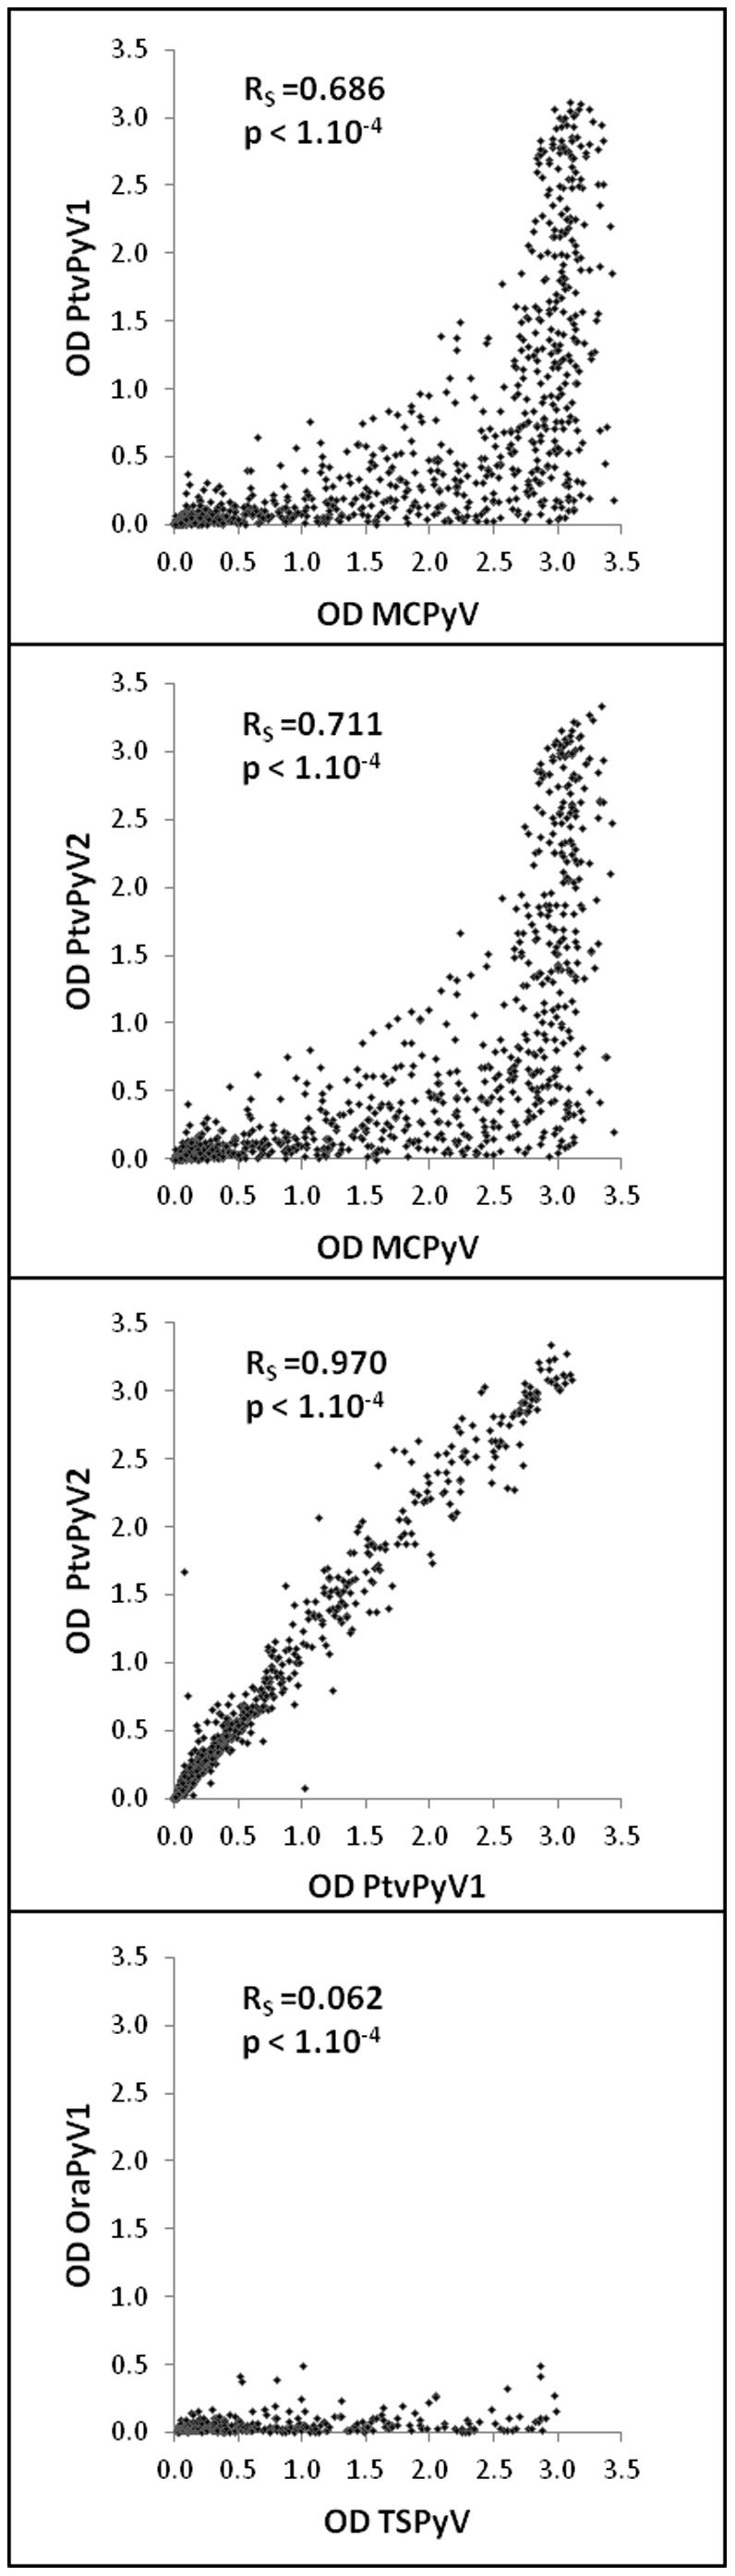
Correlation between ELISA reactivity of human serum samples against the different VLPs. Each point represents one serum sample. Correlation coefficients (Spearman) were determined using XLStat software.