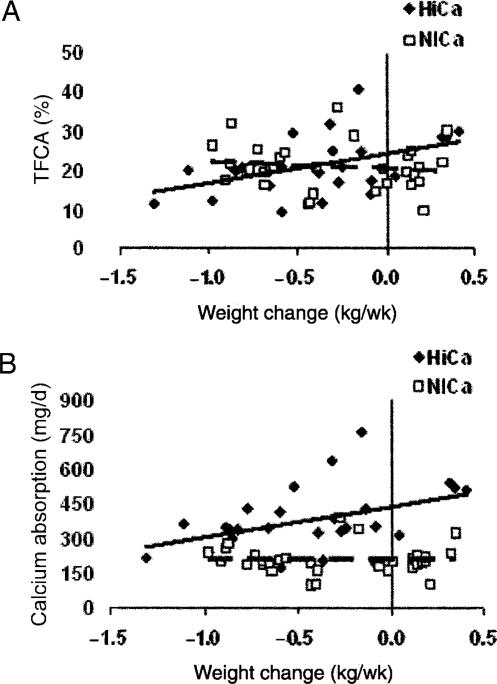
FIGURE 2.
(A) Association between the rate of weight change and true fractional calcium absorption (TFCA) [high calcium group (HiCa): r = 0.46, P = 0.018; normal calcium group (NlCa): r = –0.05, P = NS] and (B) estimated amount (mg) of calcium absorbed (HiCa: r = 0.43, P = 0.028; NlCa: r = –0.01, P = NS) after 6 wk of dietary intervention in 57 postmenopausal overweight women. Diamonds and solid line represent HiCa (n = 26), open squares and dashed line represent NlCa (n = 31).

