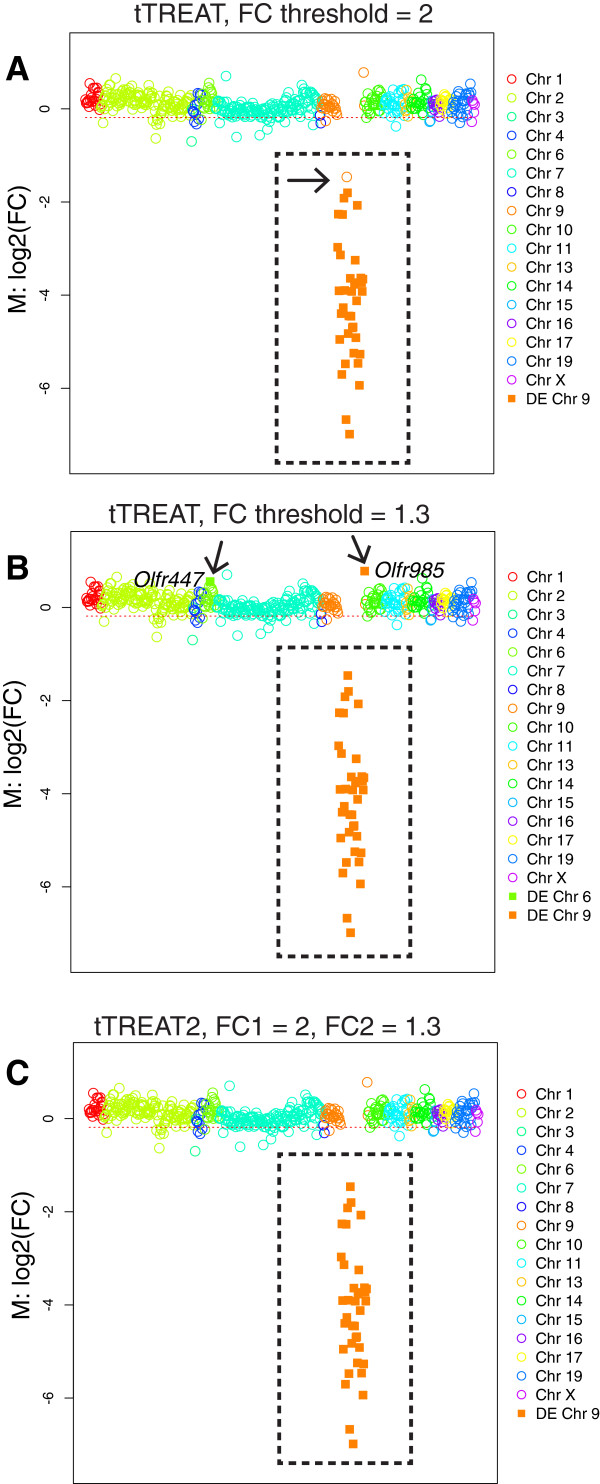
Figure 4.
The two-stage design on biological data: ΔOlfr7Δ mice. (A) MC plot of 558 OR genes. Filled squares represent genes that are identified as DE by tTREAT with an FC threshold τ of 2, comparing ΔOlfr7Δ mutant mice to control (wild-type) mice. The black stippled rectangle encompasses the 37 genes in the Olfr7 cluster deletion; these genes do not exist in the genome of ΔOlfr7Δ mice, and are thus obviously DE. The black arrow indicates a gene (Olfr916) in the Olfr7 cluster deletion that was missed, thus that was identified as non-DE. Empty circles represent non-DE genes. (B) MC plot of 558 OR genes. Filled squares represent genes that were identified as DE by tTREAT with a FC threshold τ of 1.3. The black stippled rectangle encompasses the 37 genes in the Olfr7 cluster deletion. The black arrows indicate two OR genes that were identified as DE, but reside outside of the Olfr7 cluster deletion, and therefore could be false discoveries. Because Olfr985 is close to the genomic deletion, its expression could be affected. Empty circles represent non-DE genes. (C) MC plot of 558 OR genes. Filled squares represent genes that identified as DE by tTREAT2 with FC thresholds θ = 2 and τ = 1.3. The black stippled rectangle encompasses the 37 genes in the Olfr7 cluster deletion. Empty circles represent non-DE genes. tTREAT2 now identifies the 37 genes in the deleted cluster as DE, and no other gene: there are no missed genes, and no false discoveries.

