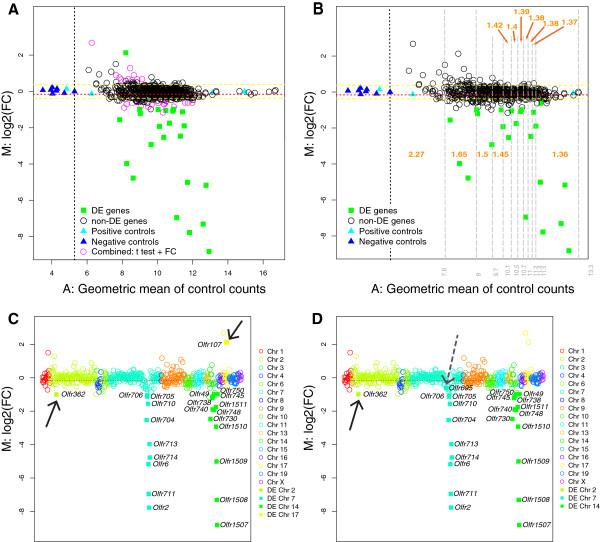
Figure 5.
Running fold change model on biological data: ΔHxΔP mice. (A) MA plot of 558 OR genes. Filled green squares represent genes that were identified as DE by tTREAT with a FC threshold of 1.5, comparing ΔHxΔP double mutant mice to control (wild-type) mice. Empty circles represent non-DE genes. The empty pink circles indicate genes that satisfy the combined criteria of a significant p value for a regular t-test (p < 0.01) and a FC value >1.5 or <1/1.5. The black vertical stippled line indicates the maximum of the negative controls. The red horizontal stippled line is the mean of the M values. The yellow stippled lines are equal to M values that represent 1.3 fold up or down: ± log2(1.3). (B) MA plot of 558 OR genes. Filled green squares represent genes that were identified as DE by a running FC model based on tTREAT. Empty circles represent non-DE genes. The grey vertical stippled lines delineate ranges of gene expression, for which various FC thresholds have been used. Orange numbers indicate the FC thresholds that are applied in the subsequent tTREAT analysis. (C) MC plot corresponding to the results shown in panel A. M values are arranged according to the relative gene order along the chromosomes, which are indicated in various colors. The black arrows indicate two OR genes that have been identified as DE, but reside outside of the H and P clusters; these are most likely false discoveries. (D) MC plot corresponding to the results shown in panel C. The solid black arrow indicates an OR gene that has been identified as DE, but resides outside of the H and P clusters, and is most likely a false discovery. The dashed black arrow indicates an OR gene that is identified as DE and resides within the P cluster; this gene is missed in tTREAT.

