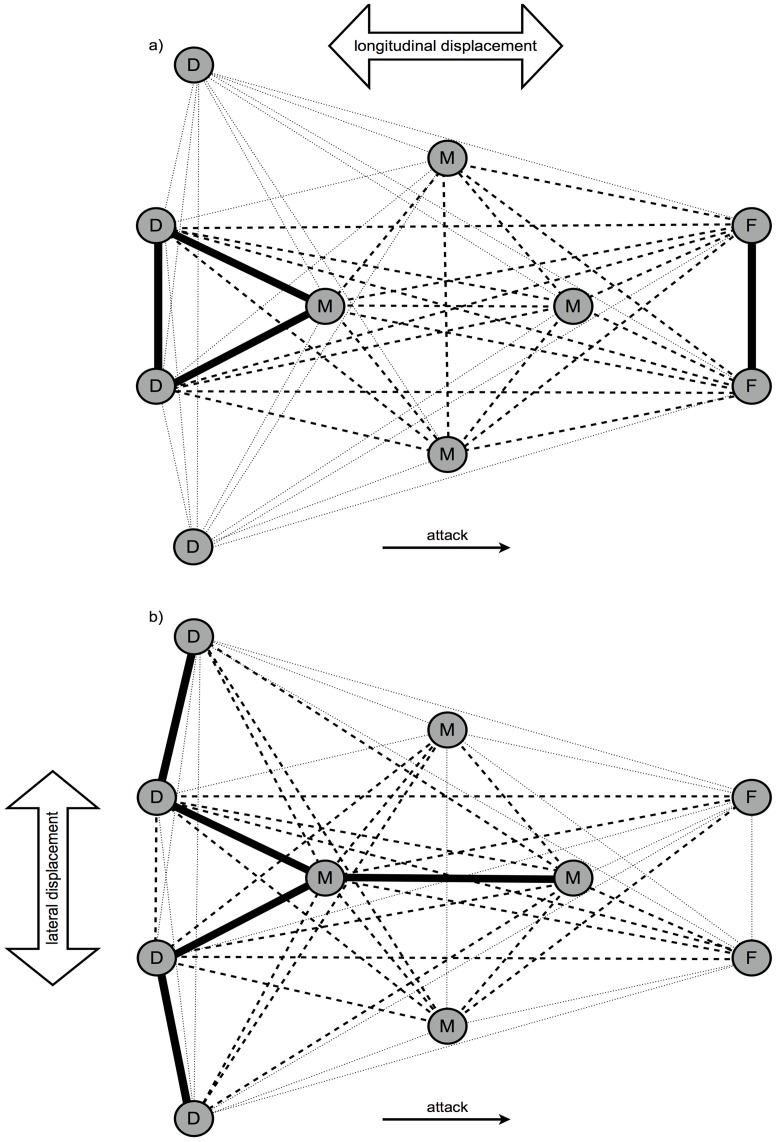
Figure 4. K-means clustering of players' according to the percentage of time of dyadic synchronization.
a) Longitudinal and b) lateral displacements of defenders (D), midfielders (M) and forwards (F). Solid lines represent the higher synchronization group; dashed lines represent the intermediate synchronization group; dotted lines represent the low synchronization group.

