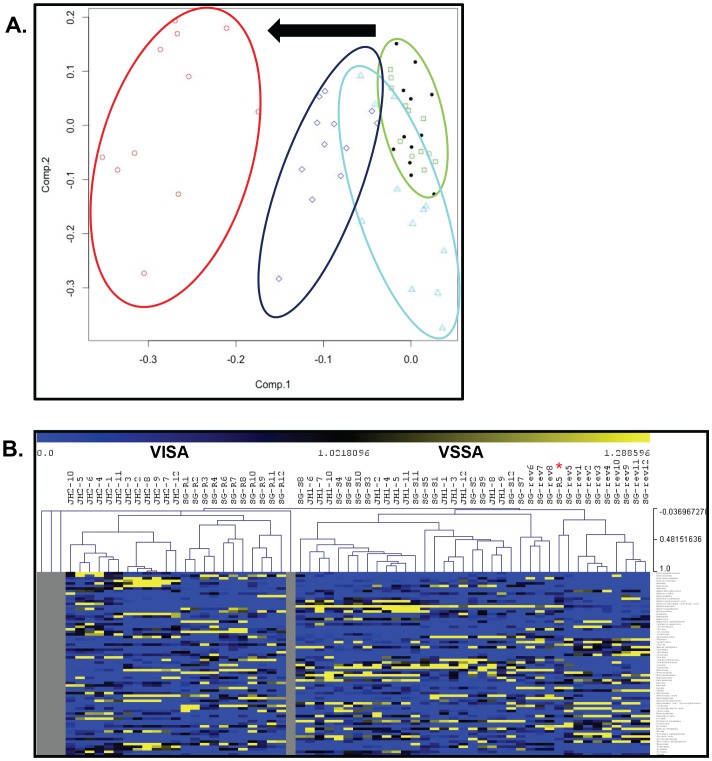
Figure 2. Principal component and hierarchical cluster analyses show separation of isolates by resistance phenotype.
Principal component analysis (A) of the metabolic profiles of all isolates from both series again shows a separation of isolates by resistance phenotype. Specifically, the metabolic profiles of parent VSSA isolates SG-S (green squares) and JH1 (black dots) form a single cluster (green ellipse), while those corresponding to VISA isolates SG-R (dark blue diamonds) and JH2 (red circles) form two separate clusters (dark blue ellipse and red ellipse, respectively) along the same vector of change (denoted by the black arrow) to the left of the VSSA cluster. The metabolic profiles corresponding to the revertant SG-rev (light blue diamonds) cluster between the susceptible parent (SG-S) and resistant (SG-R) isolates, consistent with its revertant phenotype (light blue ellipse). (B) Results of hierarchical cluster analysis also show that the metabolic profiles of all five isolates from both series separate by resistance phenotype, forming two distinct branches with the VISA isolates JH2 and SG-R on the left and VSSAs SG-S, JH1 and SG-rev on the right, though one replicate of SG-R (SG-R5) was found to cluster with the parental VSSA isolates (red asterix).

