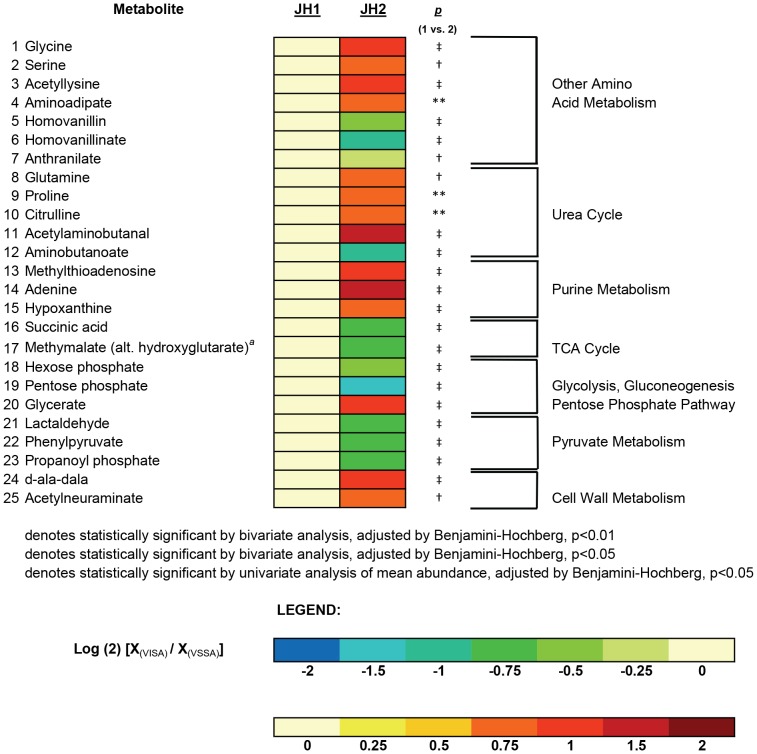
Figure 3. Heat map of Altered Metabolites in the VISA, JH2, Versus its Parent VSSA, JH1.
Heat map displaying the 25 metabolites whose abundance was significantly altered in the VISA isolate, JH2, compared against its parent VSSA, JH1. Changes in abundance are indicated by color coding with red indicative of increases in mean intracellular abundance relative to the baseline (defined by the abundance in JH1) and blue indicative of decreases in intracellular abundance on a log (2) scale. Specific p-values for the comparison of JH2 versus JH1 are denoted to the near right of the heat map. Metabolites are grouped according to pathway, denoted to the far right of each metabolite. The superscript (a) denotes unable to determine if methylmalate or hydroxyglutarate in the absence of a chemical standard.

