
Figure 8. Dynamic localization of MmpL3-N10.
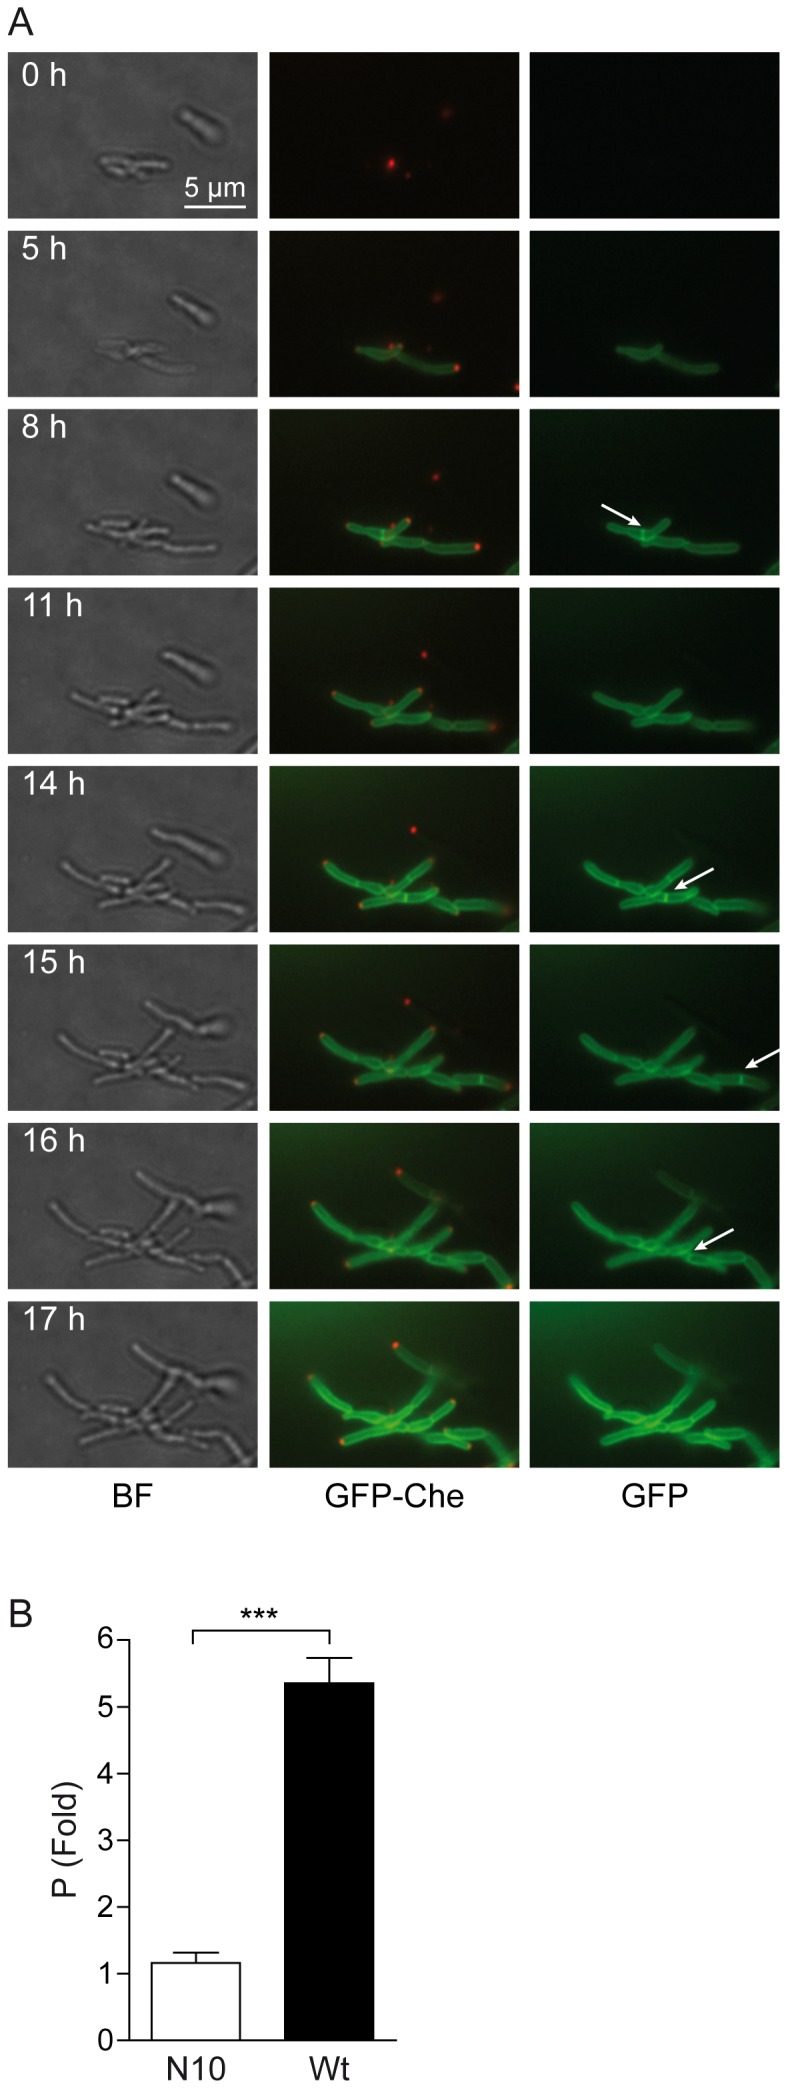
(A) Images were extracted from the movie presented as movie S13. The time interval after the starting point of the movie is indicated in hours (h). Images were extracted from three channels (bright field, BF, left column; GFP and mCherry, GFP-Che, middle column; GFP, right column). The dynamics of the localization of the GFP fusions was followed in Msm::mCherry-wag31 bacteria expressing the MmpL3-N10-GFP fusions. The presence of MmpL3-N10 in septa is indicated by white arrows in the right column. The position of mCherry-Wag31 at the poles and septa is clearly visible. Magnification: 630 X. Scale bar: 5 µm. (B) Bar graph representation of the localization of MmpL3 and MmpL3-N10 in Msm strains expressing each GFP fusion after 6 hours of induction. Data are represented as mean ± SEM. Data were collected from wide-field microscopy images (as in Figure? 7 and Figure? 8A) by scanning individual bacteria at the level of the membrane, the cytoplasm, and the poles as described in the Materials and Methods. The y-axis represents the polar accumulation (P) of either the complete (Wt) or the N-terminal portion (N10) of the MmpL3 transporter. A statistical t-test was performed to determine the difference between the polar accumulation of MmpL3-GFP (black bar, P = 5.353±0.3810 N = 192) and the absence of polar accumulation of MmpL3-N10-GFP (white bar, P = 1.160±0.1572 N = 113), with N indicating the number of bacteria analyzed. The unpaired t-test p value is symbolized by asterisks (***, p<0.0001).