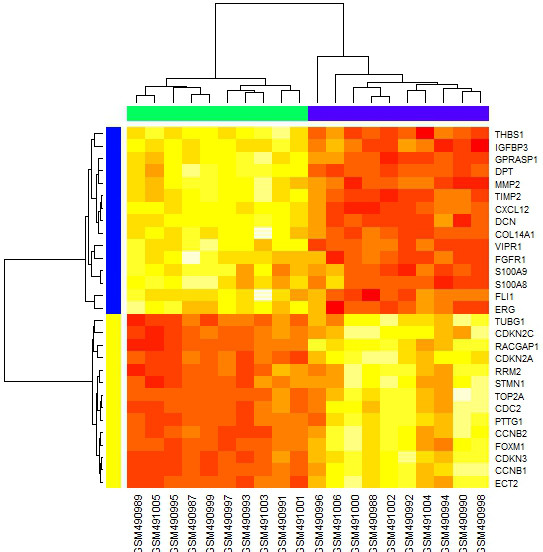
Figure 2.

Hierarchical clustering of genes in the protein-protein interaction (PPI) network. Rows represent genes and columns represents sample. The samples under the green bar were noncancerous liver samples and the samples under the purple bar were hepatocellular (HCC) samples.
