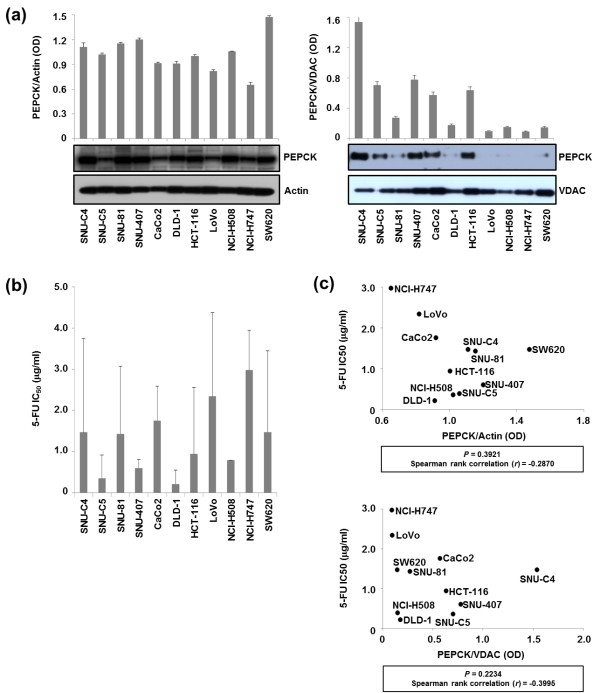
Figure 2.
Quantification of PEPCK expression levels in 11 human colon cancer lines with different responses to 5-FU. (a) The expression levels of PEPCK in whole homogenates and mitochondrial fractions of different cell lines were normalized with actin and VDAC, respectively. (b) Differential responses of cell lines to 5-FU. The 5-FU IC50 was determined in 11 colon cancer cell lines 96 h after 5-FU treatment by MTT assay. (c) No correlation was observed between mPEPCK expression and the responses of cell lines to 5-FU. The 5-FU IC50 values of the various cell lines were plotted against their PEPCK expression levels in whole homogenates (upper panel) and mitochondrial fractions (lower panel) normalized to actin and VDAC, respectively.

