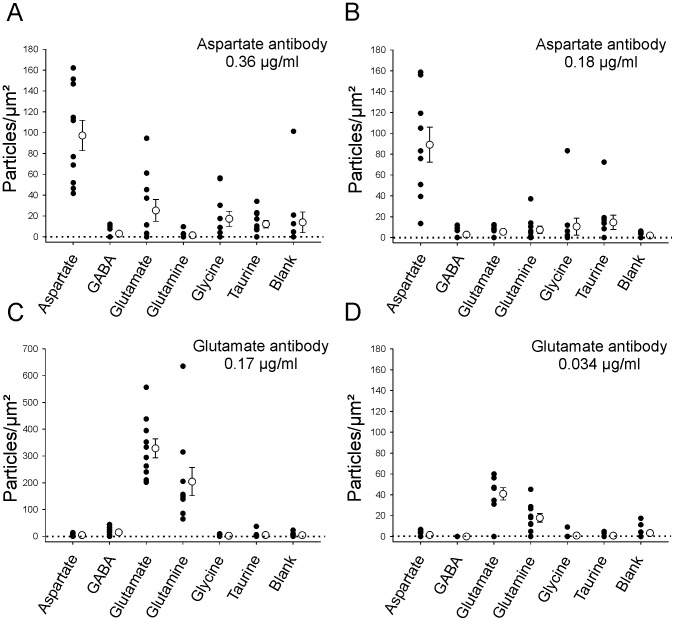
Figure 2. Quantitative analysis of aspartate and glutamate antibody labeling in resin sandwiches.
A, B, Density of labeling of amino acid enriched islands at high (A) and low (B) aspartate antibody dilutions. Filled black dots indicate individual density estimates for each sampled island. White circles show averaged data. Error bars indicate ± SEM. Dotted line indicates 0 labeling. Only aspartate-enriched islands were significantly immunolabeled above the density of blank islands (background). C, D, Similar density plots for glutamate immunolabeling at low and high antibody dilutions. Note differences in labeling density between both antibody dilutions (different y-axis values) and also the significant labeling of glutamine islands with glutamate antibodies.

