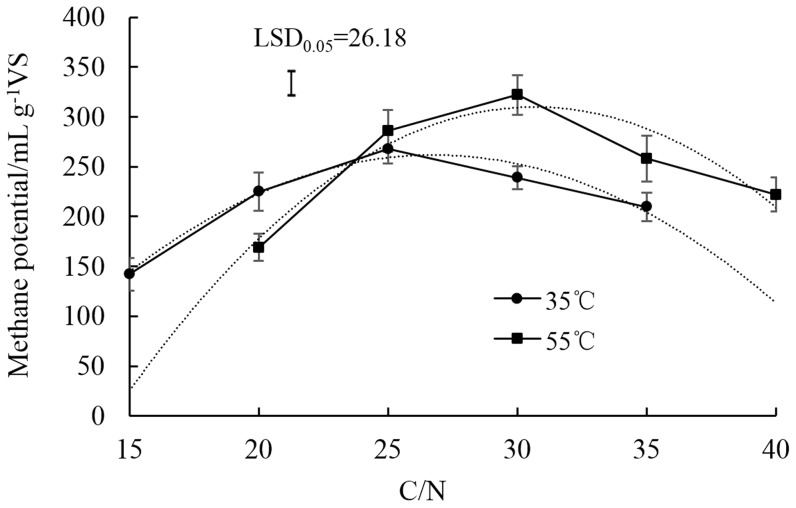
Figure 4. Changes of methane potential with different C/N ratios in the mixture of dairy manure (DM), chicken manure (CM), and rice straw (RS) in anaerobic co-digestion at 35°C and 55°C.
The dotted lines were fitting curves for both temperatures. Values are presented as the mean ±standard error of three replicates (n = 3). Vertical bars represent LSD at the 5% level.

