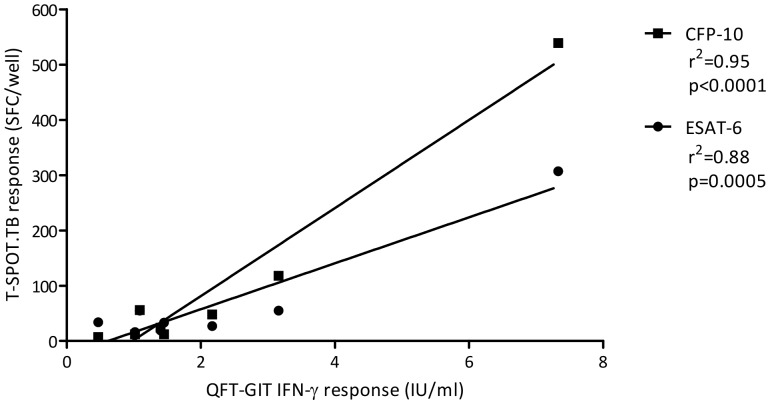
Figure 3. The relationship between the magnitude of IFN-γ response among individuals positive by both IGRAs at baseline.
Solid line represents linear correlation. QFT-GIT = QuantiFERON Gold in-Tube; IFN-γ = interferon-gamma; ESAT-6 = early secretory antigenic target-6; CFP-10 = culture filtrate protein-10; IU = international units; SFC = spot forming cells.

