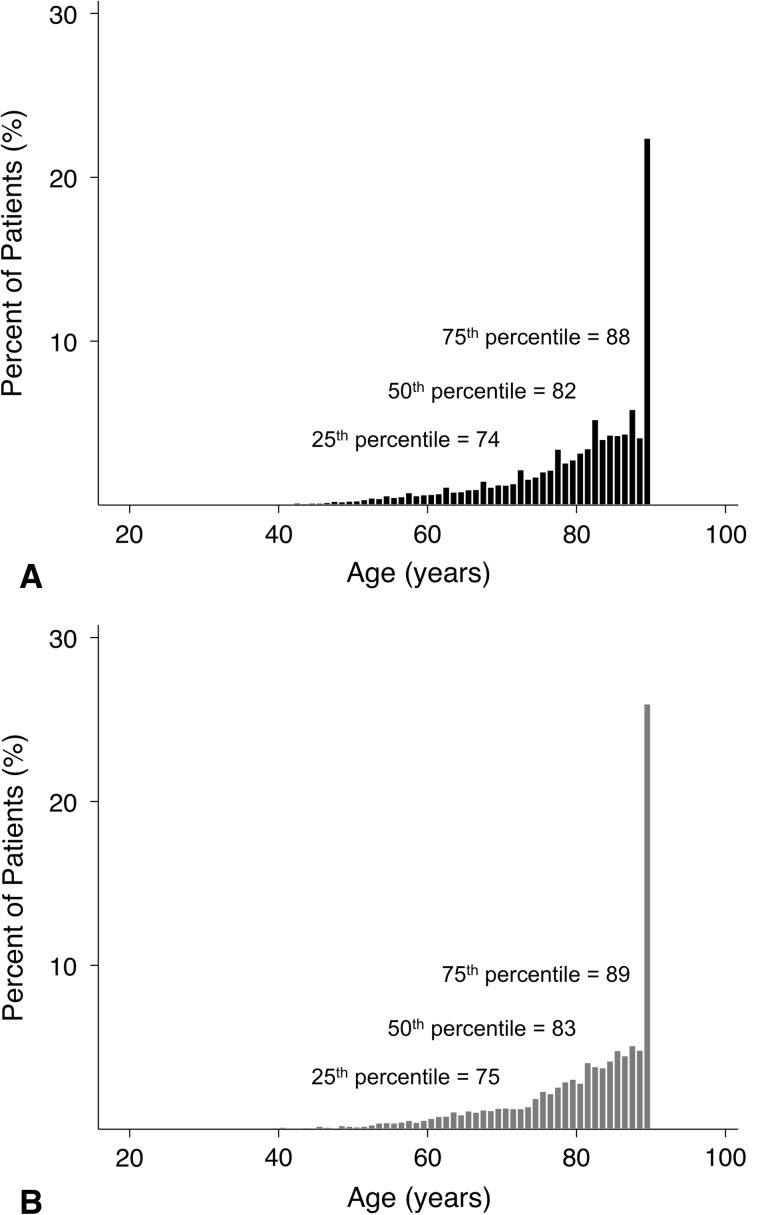
Fig. 2A–B.
The distributions of patient age for the (A) NIS and (B) NSQIP are shown. The 25th (74 and 75 years), 50th (82 and 83 years), and 75th (88 and 89 years) percentiles were within 1 year of each other. To make patients less identifiable, the NSQIP reports all patients older than 90 years as 90 years; to make data comparable, we treated patients in the NIS who were older than 90 years as 90 years. The regularly spaced spikes in the distributions are the result of some states’ requirements that age be rounded to make data less identifiable.

