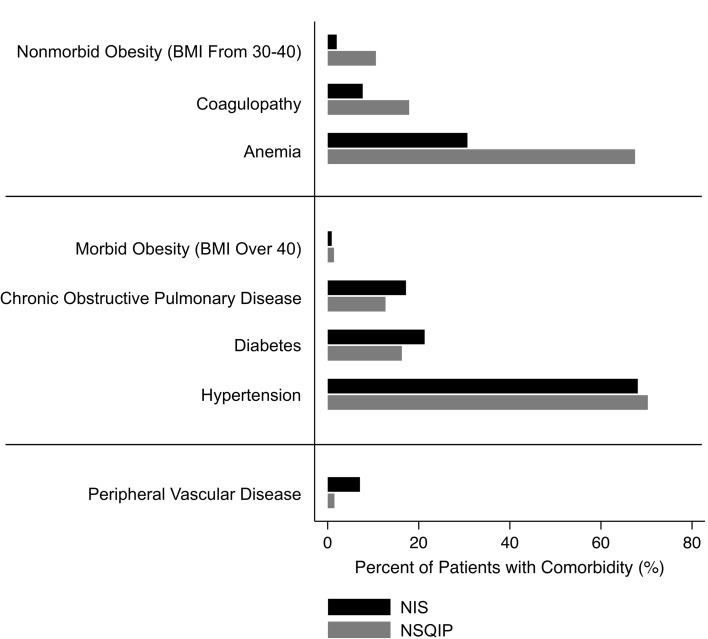
Fig. 4.
For comorbidities shown in the upper 1/3, the rate documented in the NSQIP was more than twice that in the NIS. For comorbidities shown in the lower 1/3, the rate documented in the NIS was more than twice that in the NSQIP. In the middle 1/3, the rates documented in the two databases were within a twofold difference of each other.

