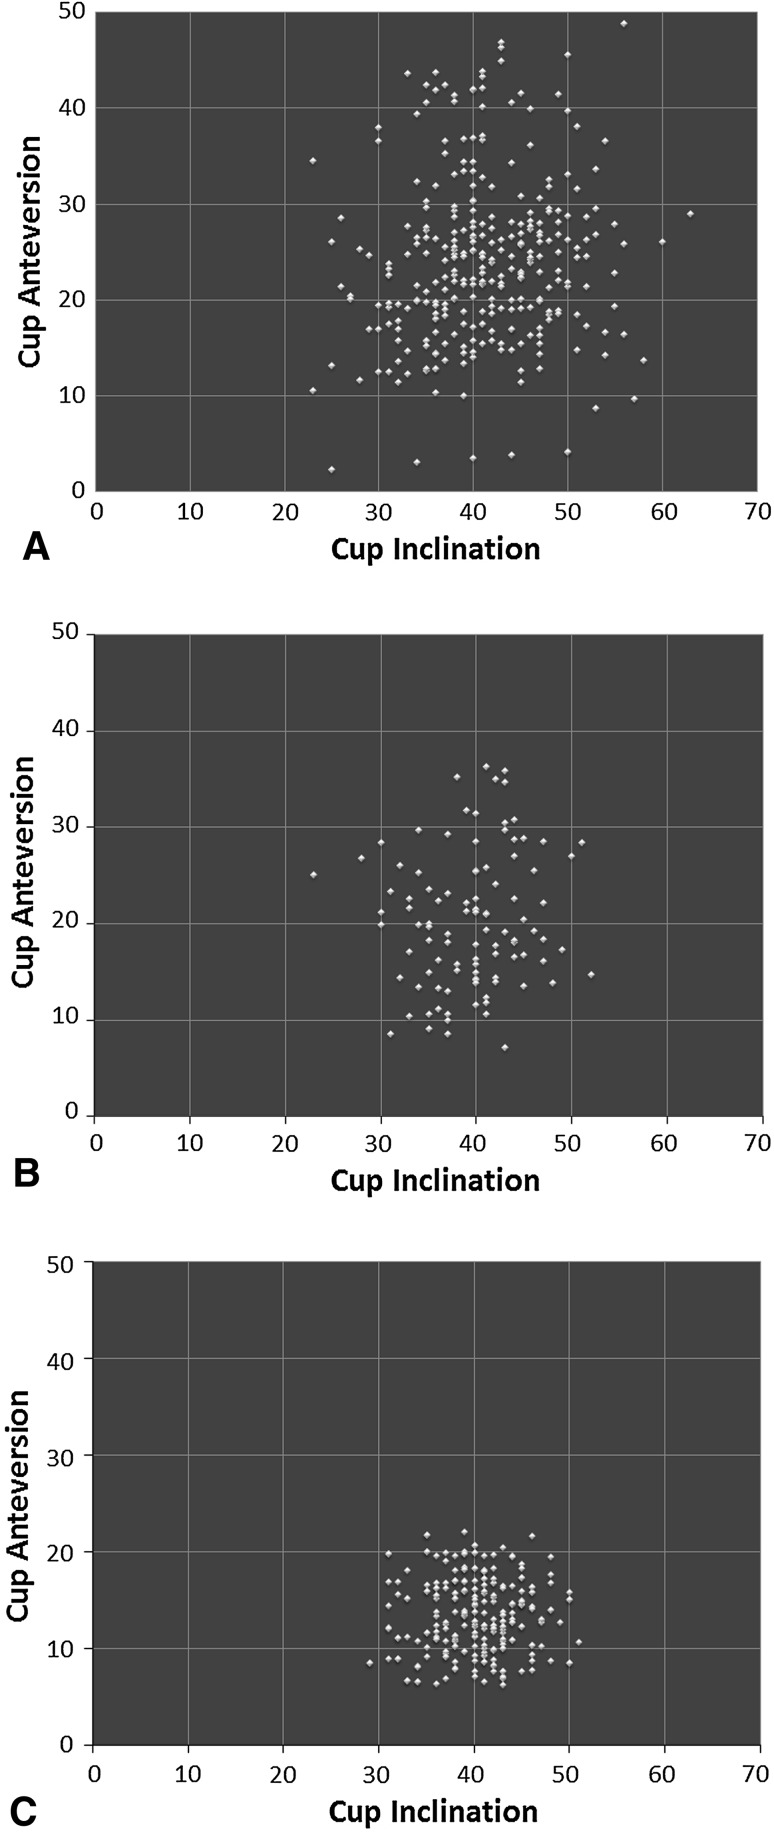
Fig. 4A–C.
The scatterplots show decreasing dispersion (thus decreased variability) across the (A) posterior group, (B) direct anterior learning approach group, and (C) direct anterior group with the highest dispersion in the posterior approach group and lowest in the direct anterior approach group.

