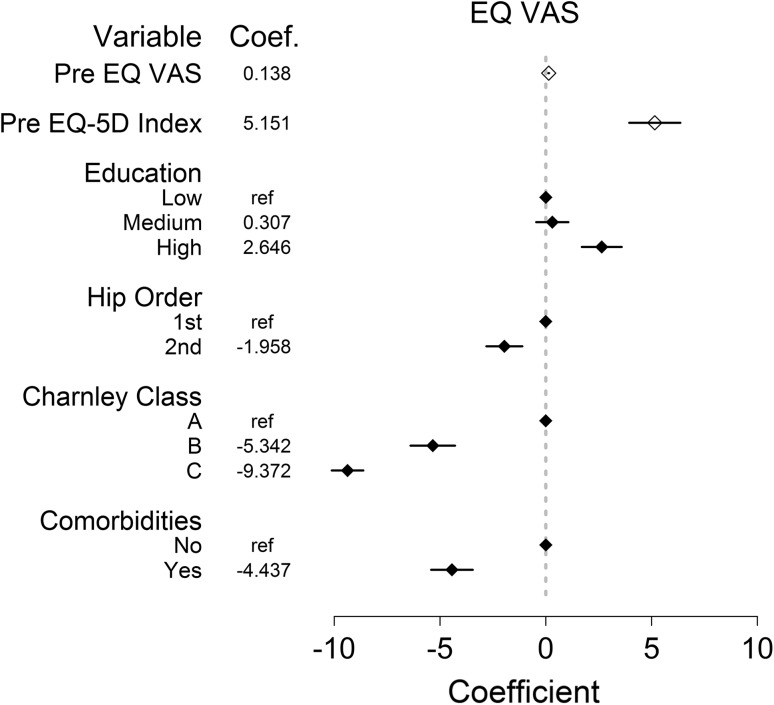
Fig. 3.
Linear regression results are shown for the independent variables (preoperative [Pre] EQ VAS, preoperative EQ-5D index, education attainment, hip order, Charnley classification, and comorbidities) included in the model where the points represent the slope coefficient (coef.) with the 95% CI for the dependent EQ VAS variable. Any variable without a CI was the reference variable (ref), and any variable whose CI did not include 0 represents a significant influence on the EQ VAS. Continuous variables are represented by an open diamond and categorical variables are represented by a filled diamond.

