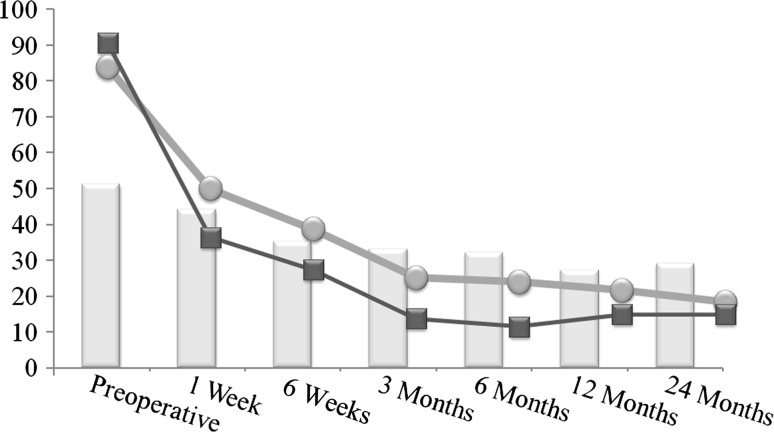
Fig. 1.
A graph shows mean scores for the ODI (bars), VAS back pain (light gray lines and dots), and VAS leg pain (dark gray lines and dots). Postoperative ODI values since the 6-week visit are significantly lower compared to baseline (p < 0.04). All postoperative VAS scores are significantly lower compared to baseline (p < 0.01).

