Figure 1.

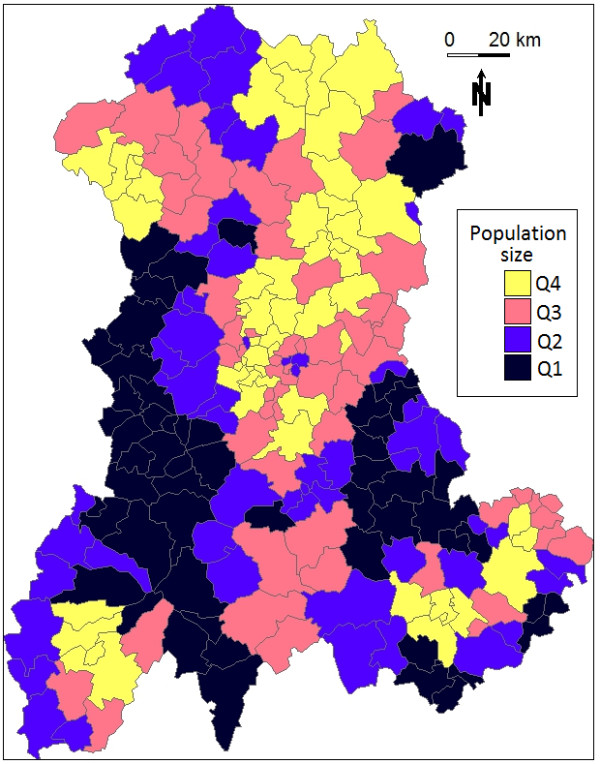
Size of the at-risk population for each cluster in the Auvergne region, as defined by mean number of live births per year between 1999 and 2006 (source: INSEE). Q1: ≤ 102; Q2: > 102 and ≤ 175; Q3: > 175 and ≤ 293; Q4: >293.

Size of the at-risk population for each cluster in the Auvergne region, as defined by mean number of live births per year between 1999 and 2006 (source: INSEE). Q1: ≤ 102; Q2: > 102 and ≤ 175; Q3: > 175 and ≤ 293; Q4: >293.