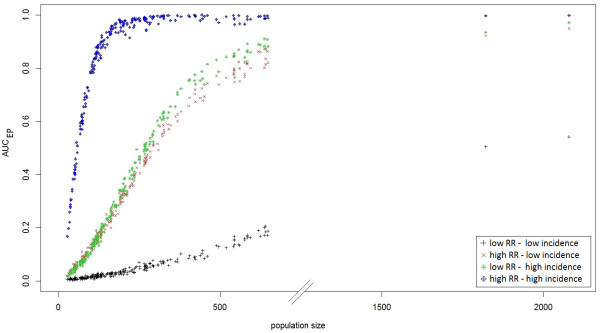
Figure 3.

AUC EP of Kulldorff’s spatial scan based on the size of the at-risk population for four combinations of two relative risk (RR) and two annual incidence of birth defects: low RR = 3 and high RR = 6; low incidence = 0.48% births and high incidence = 2.26% births.
