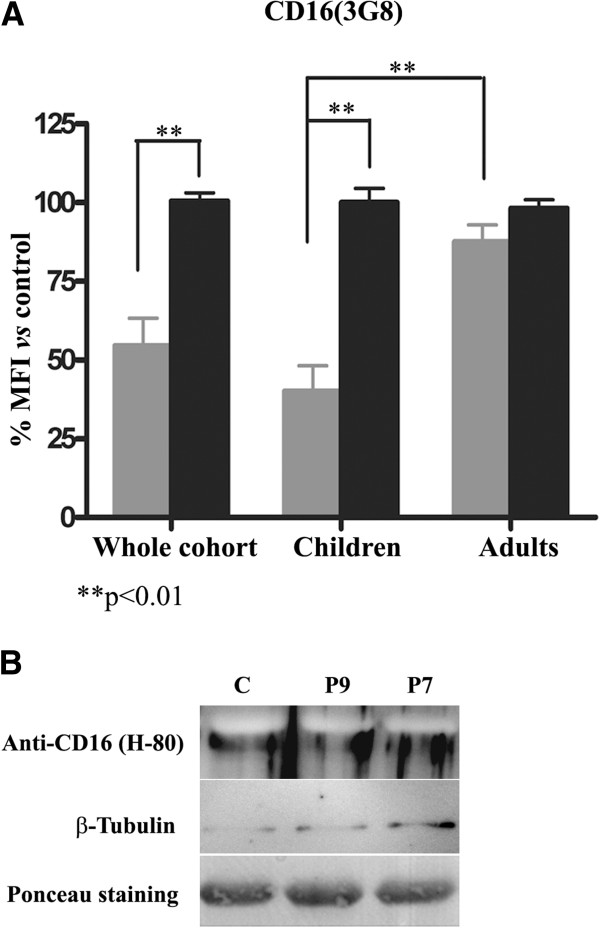
Figure 4.
Expression of CD16 in neutrophils of PMM2-CDG patients and control subjects. A) Flow cytometry analysis using 3G8 monoclonal antibody in the whole cohort of patients and according to age. Values are expressed as % mean fluorescence intensity (MFI) vs that observed in controls. B) Western blot analysis using the H-80 polyclonal antibody. As loading controls, we stained the membrane with Ponceau Red and evaluated the expression of tubulin.

