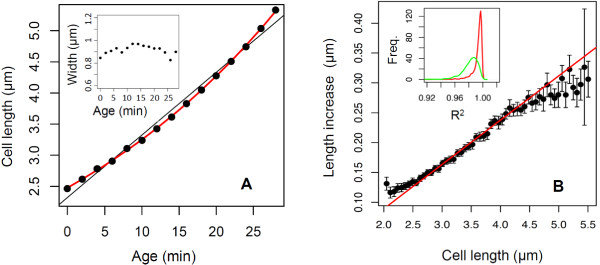
Figure 2.

Analysis of single-cell growth.(A) Cell length vs cell age for a representative cell (black dots); exponential fit (red curve) and linear fit (black line). Inset: Cell width vs cell age for the same cell. (B) Increase in cell length during one time step (i.e. 1 min) as a function of cell length for fi data. During the lifetime of a cell, the cell length is measured at each time step and the increase in cell length between successive time steps is calculated. Black dots are the average length increase for every cell of a given experiment f1, as a function of cell length; error bars are the average +/−2 SEM (standard error of the mean). The red line is a linear fit for lengths between 2.5 µm and 4.5 µm. Inset: For each single cell of f1, the evolution of cell length with age was fitted with a linear or an exponential function (as shown in panel A). We thus obtain a distribution of R2 coefficients corresponding to the linear (green) and exponential (red) fits.
